Starting this Week: Crappier Posts! (but, you know, posts)

There’s no denying that it has been pretty slow around here this year.  This is partly due to my unreliable new co-blogger:

I mean, it’s practically like I have to teach him everything from scratch.

On the other hand, I think this has just exacerbated a pre-existing issue, which is my chronic terror that something I post might not be interesting or awesome or air-tight enough (Incidentally, this is one reason I don’t publish model results or predictions very often: Even if they’re right, they’re still going to be wrong half the time, which is obv unacceptable). This gets even worse after any period of inactivity, since I feel extra pressure to come back with a bang.  But expecting everything I post to be a 150-page ebook in the making is pretty ridiculous, especially now that my time is more of a limited resource.

After considering various options, I’ve decided the best thing to do is commit to a minimal but rigid release schedule, quality be damned. So, starting tomorrow, I will be posting something every Monday, Wednesday, and Friday by 5PM PST, even if I have to pull a thought out of thin air at 4:45 and text it in. Presumably this will decrease the average quality of my posts, but I’m hopeful that it will be an improvement on no posts at all (no guarantees).

Tomorrow’s edition will be some odds and ends about this year’s ESPN Stat Geek Smackdown. But after that, it’s mystery meat as far as the eye can see.

Graph of the Day: Quarterbacks v. Coaches, Draft Edition

[Note: With the recent amazing addition to my office, I’ve considered just turning this site into a full-on baby photo-blog (much like my Twitter feed).  While that would probably mean a more steady stream of content, it would also probably require a new name, a re-design, and massive structural changes.  Which, in turn, would raise a whole bevy of ontological issues that I’m too tired to deal with at the moment. So I guess back to sports analysis!]

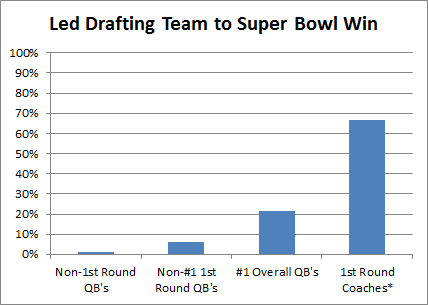
In “A History of Hall of Fame QB-Coach Entanglement,” I talked a bit about the difficulty of “detangling” QB and coach accomplishments.  For a slightly more amusing historical take, here’s a graph illustrating how first round draft picks have gotten a much better return on investment (a full order of magnitude better vs. non-#1 overalls) when traded for head coaches than when used to draft quarterbacks:

Note: Since 1950. List of #1 Overall QB’s is here.  Other 1st Round QB’s here.  Other drafted QB’s here.  Super Bowl starters here.  QB’s that were immediately traded count for the team that got them.

Note*: . . that I know of. I googled around looking for coaches that cost their teams at least one first round draft pick to acquire, and I could only find 3: Bill Parcells (Patriots -> Jets), Bill Belichick (Jets -> Patriots), and Jon Gruden (Raiders -> Bucs).  If I’m missing anyone, please let me know.

Sample, schmample.

But seriously, the other 3 bars are interesting too.

Google Autocomplete Error in My Favor

So I was scanning for funny search terms that have led wary surfers to the blog, but stumbled into the following instead (click to enlarge):

In case you’re wondering, yes, I signed out of Google and turned off search personalization first.  The URL of the search just leads to “the case for dennis rodman” results, so if you want to duplicate it, you have to enter “+/- for Dennis Rodman” yourself (without pressing enter or the search button, obv).  Incidentally, this site is only the #6 result for the original search.

I understand that my humble offering may be the only study of Dennis Rodman’s +/- stats in existence (I have no idea), but, regardless, this seems like a clear flaw in the autocomplete algorithm to me. Personally, I would like to see Google get better at making semantic distinctions, while this seems to flub one of the most basic: between search term and search result.

Incidentally, I was just going to title this post “Dennis Rodman Still Looks Like the Scariest Clown Ever,” but I didn’t want to set expectations too high.

10/9 NFL Sunday Live Blog

Alright, I made it. You know the drill, and if you don’t, details here.  Please leave comments and/or questions, etc.

1:40: Made it home just in time for the crazy ending of the Houston/Oakland game.  Interesting play within 2 minutes: Houston takes a sack, but is called for a personal foul/facemask.  Meanwhile, they go under the hood to check if Oakland had 12 men on the field, and they did.  By rule, the 12 men was declined, then the personal foul was accepted, with the end result being 1st and 25.  So the Oakland penalty is declined but still wipes out the sack?  Normally I pride myself on knowing all the obscure NFL rules, but this one was new to me.  Or maybe I missed something.

1:52: I got some questions this week about the purpose of the PUPTO metric, and how good it is as far as predicting future performance.  I’d say it’s more of a “story of the game(s)” stat than a “quality of the team” stat.  It does hold its own for predicting future outcomes, but there are a lot less crude methods in that area that are more effective (in general, turnovers should be handled more delicately).

1:55: Watching Jets and Patriots now, of course.

2:10: bottomofthe9th asks:

One other interesting question I was reminded of during that game–are timeouts over-used to avoid a delay of game penalty? Seems like they have to be, since 5 yards is almost inconsequential relative to your ability to run 3-4 extra plays late in the game. Of course it depends on what the probability is you’ll be coming back late in the game, but seems hard to believe it’s so low to justify burning a timeout just to avoid a 5-yard penalty.

I agree it would be interesting to quantify the actual value of a Time Out at various points in the game, but intuitively I’d guess that they’re not as valuable as you think.  They’re a bit like insurance, in that you’re super-glad that you had them when you need them, but I think the situations where a timeout makes much of a difference are more rare than you think.

For example, I’ve linked this before:

This table assumes you have the ball with 2 minutes left on the yardline indicated, and the four columns correspond to the number of timeouts you have.  Even on your own 10, the difference between 0 timeouts and 3 timeouts is less than 3%—and this is one of the more leveraged situations, you’d think (note: I can’t speak for the complete accuracy of the method FC used, but this is one of the few win % analyses out there I’ve seen that accounts for timeouts.  As I’ve noted before, ANFL Stats WPA Calculator does not include them).

2:18: So, from the earlier games, let’s see: Colts and Eagles lose again.  So maybe Peyton Manning is more valuable than a few wins, and maybe spending a lot of money on free agents isn’t a good way to get and NFL Championship.  I’m feeling like it’s about time for another one of my big “I Told You So” round-ups.

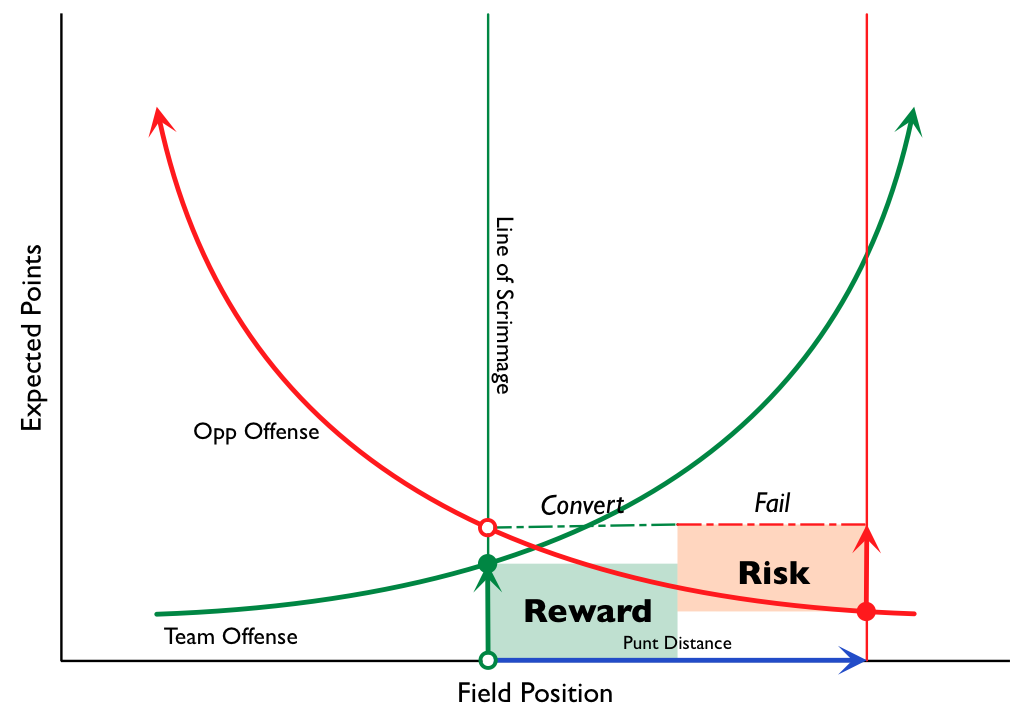
2:28: So here’s something I drew up on my iPad while I was without internet over the weekend.  It’s a generic visualization of a Punt/Go For It decision:

I have a longer post in the works that explains better and uses some actual data, but despite looking complicated, I think it’s actually a pretty simple way of analyzing these situations quickly.  In particular, it lets you adjust for relative team strength and/or type of offense without having to resort to complicated math (you can just “shock” the curves like you would in an econ class).

2:40: “Bills force late INT to finish off fading Eagles” is one of ESPN’s headlines for the Bills/Eagles game.  Not saying Vick didn’t screw the pooch in this one, but as I’ve been harping on the past couple of weeks, if there’s a time to risk throwing an interception, it’s when you’re down by 5 with under 2 minutes left.  If I were the coach and that drive ended with anything other than a touchdown or an interception, I’d be pissed.

2:46: I should make this a TMQ-like running item: “Interception of the Week,” celebrating the game-losing turnovers that happened at the most appropriate time to gamble.  It’s a bit like back when I played a lot of live poker: I used to record my “worst” river calls (where I called with some ridiculously weak hand and ended up being up against a monster), and then I’d brag about them to my friends.

2:51: Man, when did Wes Welker become New England’s “greatest asset”?  I remember when he was on the Dolphins, I thought he was underrated as a situational player, and I was unsurprised to see the Patriots pick him up.  Then his numbers went way up with Randy Moss, which I would have expected, and I kind of thought he got a bit overrated.  But now with Moss in the wind, he’s putting up even bigger numbers.  Crazy.

2:55: So my Quantum Randy Moss post—though the most popular non-Dennis Rodman post I’ve ever written—is one of my least brag-worthy in terms of results: Since I posted it (at the start of last season), Moss had his first 0 catch game, was dumped by two teams, was a non-factor on another, retired in a huff, and reportedly New England wouldn’t even take him back for less money.  I mean, I stand by my analysis, but what an unexpected disaster.

3:15: David Myers: I’ll look into that in a bit.  You could be right that I missed something, but it seemed to work out when I did it on paper.

3:20: So the “Reward” in that graph is the value of your drive times the odds of making the first down, and the “Risk” is the value of the opponent’s drive on the current LoS vs. where they would be expected to get the ball after a punt (times the chances of your failing to convert).  So you’re saying the green arrow on the left should extend to the opp’s drive value curve, but I’m not getting why.

Wouldn’t that be double-counting?

3:30: Nevermind, I get what you’re saying, misread your comment.  You’re saying you should also count denying the opponent a possession at all.  But outside of time-pressure scenarios, I don’t think that has any additional value (aside from what’s already covered in my proportions).

4:07: Argh, I’m getting bogged down in some database mechanics for an idea I was just having.  Note to self: don’t do massive original research projects during the live blog.

4:10: Myers expanded on his comment:

If you punt on play N, then the transition of scoring potential from play N to play N + 1 is from the green solid point to the red solid point, or A + C. The value of the _possession_ in turn has to be the additive inverse of that (plus whatever value is gained by the additional yardage made to get the first). Note this is logically equivalent to the argument about turnover value from The Hidden Game of Football (pp 102-103, 1988 edition). This valuation scheme is not original to me.

I’ll have to postpone looking into this until I have more time (love the academic citation btw).

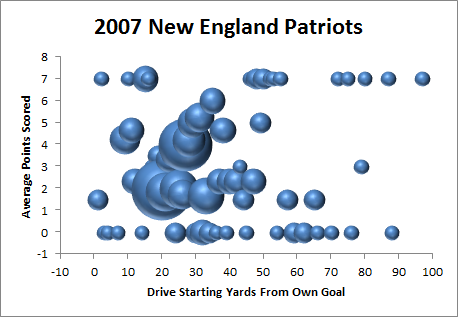
4:52: Ugh, a little less than timely.  I was trying to find a more elegant way of doing this, but here’s a graph of the 2007 Patriots offense:

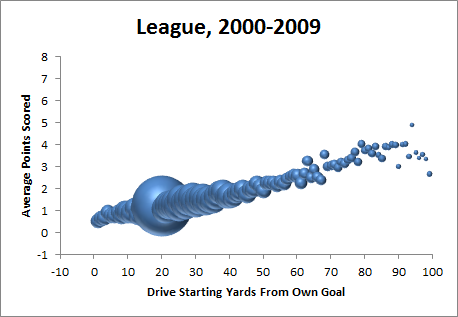
5:07: And here’s the comparison pic:

5:15: FWIW, the linear trendline equations for those two graphs are

y = .014x + 2.58

and

y=.036x + .49

respectively.

5:20: I just built those graphs from play-by-play data, which I started during the New England game (see, I was trying to reminisce about the crazy 2007 New England offense that you should never ever punt to).  Not only is that game over, but the night game is starting.  Sometimes I definitely overestimate my own speed.

5:23: Short break and I’ll be back with some crazy Aaron Rodgers stats.

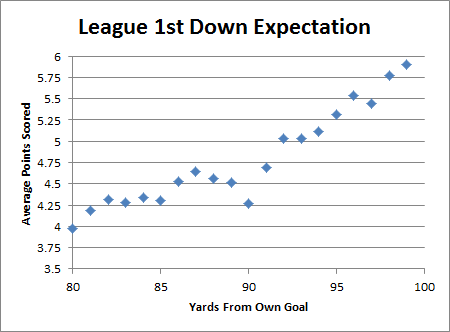
5:40: Ok, quick side-product of what I was doing above: here’s a graph of expected points resulting from a 1st down on each yard line in the red zone:

6:02: Also, I don’t think the variations in that graph are all noise.  First, the sample is pretty huge (n=15,088),  and it’s consistent with other research I’ve done about the bizarre things that happen with a “compressed field.”  Here are some of the features that I can see and the theoretical justifications:

  1. There’s a decline right before the 10 yard line, with the 10 yard line itself being a pretty serious local minimum.  I think this happens because of the shortened field and the increasing difficulty of getting a first down without getting a touchdown (e.g., from the 11 yard line, you can only get a first down inside the 1, but from the 13 yard line you have 3 yards to work with).  This is relevant b/c the odds of a touchdown on any given play from the 10, 11, 12 aren’t that different.
  2. There’s a flattening that occurs between the 20 and the 15: I think this is where you first experience “compressed field” issues (less room for receivers to run).  But then around the 15, I think the effect is “complete” (at least for a while), and the natural advantage of being closer takes over again.
  3. There’s a “statistically significant” outlier on the 3 yard line, where 1st and goal on the 3 is actually less valuable than 1st and goal on the 4.  I’m fairly certain that this at least in part due to configuration issues (as you have limited offensive options on the 3), though I think it may also be caused by poor play selection.  Specifically, teams call a much higher percentage of running plays from the 3 than from the 4, while defenses are pretty much always stacked against the run.
  4. The slope at the 10 going down to the 8 is somewhat greater than in other areas of the graph where the expectation is increasing linearly (incidentally, as I mentioned 2 weeks ago, this is one of the things that makes EPA and WPA models difficult: you have some pretty dramatic shifts over a small number of yards, and you can’t really model it with a continuous equation).  This effect I also think might have something to do with play selection, or even 2nd-order play selection: that is, teams pass a fair amount, which is good, running is also fairly effective (b/c defenses are more focused on pass), and successful runs often leave them at a yardline (like the 4+) where they are still willing to pass.

Really, it may seem crazy, but I’ve looked into most of these effects and have found support for them.

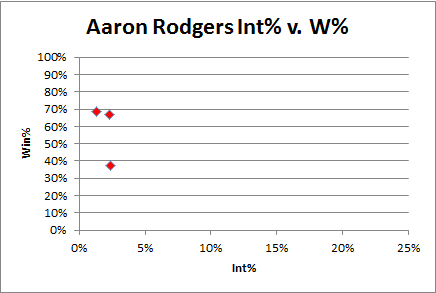
6:36: Ok, as I’ve noted before, Rodgers’ consistently low interception % is pretty unusual, though of course his sample size is tiny:

Now let’s compare to the rest of the league (starting at least 8 games):

Obviously he is way on the left side of this blob, and his “slope” (if you can call it that with only 3 points so far) is much higher.

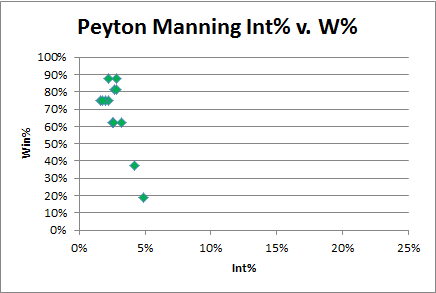
6:40: Let’s compare to Peyton Manning:

Rodgers’ Int% with a 40% win rate is almost half that of Peyton Manning’s (and, it goes without saying, Manning is a pretty consistent QB).

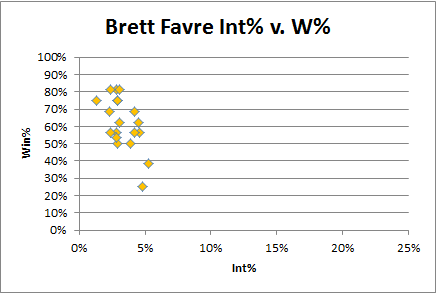
6:45: And, of course, what Rodgers analysis could be complete without comparison to Brett Favre:

6:52: I should note, of course, that I have no problem with Favre or Manning’s numbers here.  I cite Rodger’s consistency not b/c I think it’s necessarily better, but just b/c it’s interesting.  I would expect a QB to have a higher Int% when playing for a losing team, whether he is consistent or not.  Generally, I think a relatively high “shot group” on this graph, with a relatively low slope, can be a good thing: It may simply reflect that the QB is taking necessary risks when required to (though, clearly, isolating the causes and effects is incredibly difficult).

7:00: I see Tiger Woods bounced back with three 68’s in a row in the Frys.com tournament.  He finished tied for 30th.  In what is basically a “Quest for the Card” tournament.  In a field that contained 9 of the world’s top 100 players.

Comeback?

7:15: Atlanta is such a sneaky franchise. They seem to be competitive every couple of years, putting together good-to-great regular seasons, but haven’t won more than one playoff game since 1998.  I think you can win with great passing and great running, great defense and great running, but you can’t win with great running alone.  Their performance, to me, seems like a classic run good/run bad situation, where they probably haven’t changed all that much year to year, but being a little better than average keeps them occasionally in contention (while still being at a disadvantage against the actually better teams that they have to face in the playoffs).

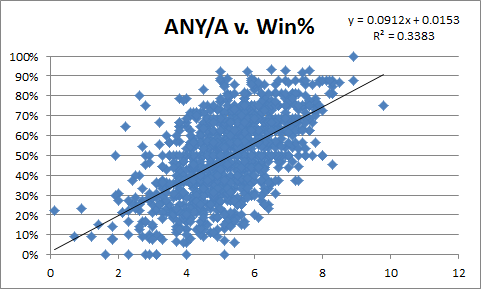
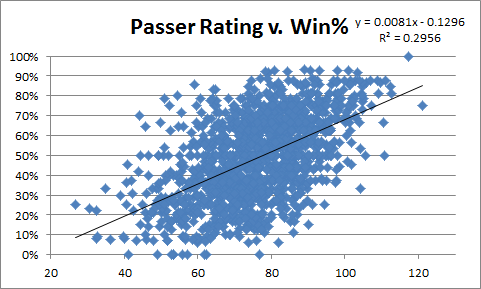
7:42: Rodgers has a sick Adjusted Net Yards Per Attempt (generally considered the best non–play-by-play single QB metric) this season, leading the league with 9.7 going into this weekend.

So, out of curiosity, I was kind of curious just how much better ANY/A is than the pariah of QB stats: the NFL Passer Rating.  So here are a couple of simple scatter-plots, ANY/A first:

And here’s PER:

ANY/A obv does better, though maybe not as much as I would have guessed.

7:47: Of course, both stats are subject to causation/entanglement issues, ANY/A possibly even moreso (as it includes sacks and weights interceptions more heavily).

7:54: That style of touchdown where a receiver has one defender, breaks for the sideline, then turns, leaps and stretches out for the touchdown, is always hailed as a great play, despite being completely textbook and despite being executed pretty much exactly the same way by every receiver in the NFL—normally differing only by whether they are close enough and have a good enough angle to get inside the pylon.

7:58: Man, I’m excited for Detroit/Chicago tomorrow.  Can’t remember the last time I thought that.

8:14: Ok, I can’t help but return to this David Myers point from earlier:

If you punt on play N, then the transition of scoring potential from play N to play N + 1 is from the green solid point to the red solid point, or A + C. The value of the _possession_ in turn has to be the additive inverse of that (plus whatever value is gained by the additional yardage made to get the first).

I don’t think the possession has value in addition to its scoring potential, or at least not as much as you’re suggesting.  This method you’re describing counts the value of not giving the opponent the ball in addition to the value of keeping the ball for yourself.  But I really think you shouldn’t do that, since you haven’t decreased the expected possessions for the game of your opponent—or, at least, you certainly haven’t decreased it by 1.  They are still going to get the ball when your possession is over.  By holding the ball now, you make it slightly more likely that the last drive of the game will be yours (depending on how much time is left, etc), but you’re still going to be trading possessions 1 for 1.

For an analogy, think of rebounding in basketball: Occasionally I’ve heard casual fans suggest that offensive rebounds must be more important than defensive rebounds because you not only get a possession but you take one away from your opponent.  But this is strictly false: A rebound is worth one possession regardless (note, of course, offensive rebounds probably are more valuable than defensive rebounds, but only because you are less likely to get them).  What you gain by getting an offensive rebound is exactly your expectation for your new possession, b/c the other team is still going to get the ball back when it’s over.  I can’t see any distinction between this and converting a 4th down.

8:24: Also, it’s true that, depending on where you are on the field, your opponent may be expected to get the ball back in a worse position.  But this effect should be included in whatever you use for value on the Y-axis.  At least, a perfect metric for the Y-axis would include it (though I think a proxy like expected points is good enough for most approximations, which is what that graphing method is all about).

8:29: Wow, can’t wait for that Packers/Chargers game.

8:32: Game, set, match.  Respect to Aaron Rodgers for breaking a Kurt Warner record (PER over first 1500 attempts).  Was there anything more incredible in the history of football than the 1999 Rams?

From the Live Blog: Drive Outcomes From Deep in Your Territory

[For ease of reference—with apologies to those of you who sat through or otherwise already read my NFL Live Blog from this Sunday—I’m once again splitting a few of the topics I covered out into individual posts. I’ve made mostly made only cosmetic adjustments (additional comments are in brackets or at the end), so apologies if these posts aren’t quite as clean or detailed as a regular article. For flavor and context, I still recommend reading the whole thing.]

[See also my Addendum below.]

Random stat from my PBP database:  For home teams, 19% of drives starting with a kickoff end in a touchdown, for away teams, just under 17%.  But on the first drive of a game, home teams score TD’s on 22%, away teams just 16%.

Any time I start wading through PBP stuff, I get easily distracted.  There’s something new and fascinating around every corner! [E.g.], here’s what should be considered a pretty basic graph, but it has some interesting subtleties to it:

One of the most interesting parts is what’s going on in the first 20 yards:

So what’s interesting about this? Well, that aside from safeties, these particular results are very linear.  I think many people would expect that being backed into your endzone makes executing your offense a lot harder — but aside from the occasional safety, the outcomes are really no worse than what you would expect from just being more yards back (turnovers aren’t shown b/c of data mashing issues, but there’s not a massive jump for them either).

Of course, another important factor [is the effect on punting]:

And, the corresponding graph limited to your own 20:

So the take-homes from the above graphs are that the situation gets significantly better/worse within the 5 yard line, accelerating as you approach the goal line.  [Though the effect may not be as apparently strong as some probably thought,] this is why kicking field goals from the 1 is terrible even in situations where it has some tactical benefit.  Obv this is nothing new to anyone even slightly informed about “expected value” in football (it’s basically the prototypical example), but to break it down clearly: If you don’t score on your 4th down play, trapping your opponent in that spot is valuable 4 ways:

  1. Natural field position advantage vs. giving your opponent the ball on the 20 after a made field goal.
  2. Significantly increased chance of a safety.
  3. Increased chance of good field position b/c of short opponent punts.
  4. Your subsequent field position also starts to hit the increasing part of your Touchdown/Expected Points curve (i.e., it has value in addition to the generic value of better expected field position).

Though it should be noted that the last 3 effects are much stronger on the 1 than on the 5.

Matt notes:

I was just able to use the drive expectancy chart to check on a Chris Collinsworth comment, love all the graphs and tools. BTW the comment was about the value of getting the ball on the 2-3 vs the half yard line, if I read the graph right the odds of a safety double at the 1 yard line vs the three yard line. Still only 6% but a big enough difference to care.

Yes, there’s a significant difference between the two, and it gets more and more dramatic the closer you get to the plane: there’s a pretty significant difference from being at the 1 and being at the 1/2, etc.  It’s also true on the other side of the field: all kinds of wacky things happen as you approach the Endzone, and they’re not all intuitive.

In fact, one of the big difficulties with building a [Win Percentage Added] model is accounting for these kinds of situations empirically, because 1) they behave abnormally, and 2) they’re either rare (e.g., being right at your own end zone), or extremely specific (e.g., some of the things that happen around the 11-12 yard line in the Red Zone), and thus have some of the smallest sample sizes for observation.

Addendum:

David Myers (of Code and Football) also comments:

Why ask? I think the result is important, and I was curious how reliable the data set was. 9 years is a lot of data [note: it’s actually 10 years].

A further explanation would be this: I’m curious why the expected points curves of, say, Keith Goldner and Bill Connelly and Romer/Burke are different. I’ve speculated on the difference here. Your plot suggests that different drive scoring has to be at the root of those differences, as safeties alone can’t account for the first and 10 expected points curves I’ve seen.

Yes, this is what I was getting at in that last paragraph.  It’s a bit like physics: it’s easy to build models that explain all the common and relatively simple situations. But it gets much more difficult in the extremes, which can be more complicated, often have less data to analyze, and what data is available is often less reliable.

From the Live Blog: Baseball Haterade (With NFL Regression Tangent)

[For ease of reference—with apologies to those of you who sat through or otherwise already read my NFL Live Blog from this Sunday—I’m once again splitting a few of the topics I covered out into individual posts. I’ve made mostly made only cosmetic adjustments (additional comments are in brackets or at the end), so apologies if these posts aren’t quite as clean or detailed as a regular article. For flavor and context, I still recommend reading the whole thing.]

In support of last night’s screed [Why Baseball and I are, Like, Unmixy Things], especially the claim that “[MLB] games are either not important enough to be interesting (98% of the regular season), or too important to be meaningful (100% of the playoffs),” here’s a graph I made to illustrate just how silly the MLB Playoffs are:

Not counting home-field advantage (which is weakest in baseball anyway), this represents the approximate binomial probability [thank you, again, binom.dist() function] of the team with the best record in the league [technically, a team that has an actual expectation against an average opponent equal to best record] winning a series of length X against the playoff team with the worst record [again, technically, a team that has an actual expectation equal to worst record] going in.  The chances of winning each game are approximated by taking .5 + better win percentage – worse win percentage (note, of course, the NFL curve is exaggerated b/c of regression to the mean: a team that goes 14-2 doesn’t won’t actually win 88% of their games against an average opponent. But they won’t regress nearly enough for their expectation to drop anywhere near MLB levels).  The brighter and bigger data points represent the actual first round series lengths in each sport.

By this approximation, the best team against the worst team in a 1st round series (using the latest season’s standings as the benchmark) in MLB would win about 64% of the time, while in the NBA they would win ~95% of the time.  To win 2/3 of the time, MLB would need to switch to a 9 game series instead of 5; and to have the best team win 75% of the time, they would need to shift to 21 (for the record, in order to match the NBA’s 95% mark, they would have to move to a 123 game series.  I know, this isn’t perfectly calculated, but it’s ballpark accurate).  Personally, I like the fact that the NBA and NFL postseasons generally feature the best teams winning.

Moreover, it also makes upsets more meaningful: since the math is against “true” upsets happening often, an apparent upset can be significant: it often indicates—Bayes-wise (ok, if that’s not a word, it should be)—that the upsetting team was actually better.  In baseball, an upset pretty much just means that the coin came up tails.

Adam asks:

In the MLB vs. NFL vs. NBA Playoffs graph, the chances of best beating worst in first round for NFL for a 1 game series is almost 95%.

Looking at the odds to this week’s NFL games, the biggest favorite was GB verses Denver and they were only an 88% chance of winning by the money line (-700). Denver is almost certainly not a playoff team, so it’s tough to imagine an even more lopsided playoff matchup that could get to 95%. What am I missing?

I sort of addressed this in my longer explanation, but he’s not missing anything: the football effect is exaggerated. First off, to your specific concern, this early in the season there is even more uncertainty than in the playoffs.  But second, and more importantly, this method for approximating a win percentage is less accurate in the extremes, especially when factoring in regression to the mean (which is a huge factor given the NFL’s very small sample sizes).

In fact, the regression to the mean effect in the NFL is SO strong, that I think it helps explain why so many Bye-teams lose against the Wild Card game winners (without having to resort to “momentum” or psychological factors for our explanation).  By virtue of having the best records in the league, they are the most likely teams to have significant regression effects.  That is, their true strength is likely to be lower than what their records indicate.  Conversely, the teams that win in the bye week (against other playoff-level competition), are, from a Bayesian perspective, more likely to be better than their records indicated.  Think of it like this: there’s a range of possible true strength for each playoff team: when you match two of those teams against each other (in the WC round), the one who wins might have just gotten lucky, but that particular result is more likely to occur when the winning team’s actual strength was closer to the top of their range and/or their opponent’s was closer to their bottom.

I’ve looked at this before, and it’s very easy to construct scenarios where WC teams with worse records have a higher projected strength than Bye team opponents with better records.  Factor in the fact that home field advantage actually decreases in the playoffs (it’s a common misconception that HFA is more important in the post-season: adjusting for team quality, it’s actually significantly reduced—which probably has something to do with the post-season ref shuffle: see section on ref bias in this post), and you have a recipe for frequent upsets.

In retrospect, I probably should have just left the NFL out of that graph.  Basketball makes for a much better comparison [both aesthetically and analytically]:

From the Live Blog: More on Cam Newton

[For ease of reference—with apologies to those of you who sat through or otherwise already read my NFL Live Blog from this Sunday—I’m once again splitting a few of the topics I covered out into individual posts. I’ve made mostly made only cosmetic adjustments (additional comments are in brackets or at the end), so apologies if these posts aren’t quite as clean or detailed as a regular article. For flavor and context, I still recommend reading the whole thing.]

[This is sort of following up on last week’s live blog, where I discussed Cam Newton’s hot start a little, so I’ll include that snip first.]

Last Week, On Cam Newton:

Watching pre-game.  Strahan is taking “overreaction” to a new level, not only declaring that maybe the NFL isn’t even ready for Cam Newton, but that this has taught him to stop being critical of rookie QB’s in the future.

But should I be more or less excited about Cam Newton after his win today?  He had a much more “rookie-like” box of 18/34 for 158.  Here’s how to break that down for rookies: Low yards = bad. High attempts = good.  Completion percentage = completely irrelevant. Win = Highly predictive of length of career, not particularly predictive of quality (likely b/c a winning rookie season gets you a lot of mileage whether you’re actually good or not). Oh, and he’s still tall:  Height is also a significant indicator (all else being equal).

This week:

Google search that just led to the blog: “should I start Michael Vick over Cam Newton today.”  Welcome, fantasy footballer!  And sorry, I have no idea.  I don’t play fantasy football anymore: it’s pleasantly time consuming and has near-infinite depths for analysis, but the overlap with analysis of things that matter is way too small. [This was a bit harshly put, but I mean something serious: I’m increasingly convinced that NFL box score accomplishments have little relation to actual player values].

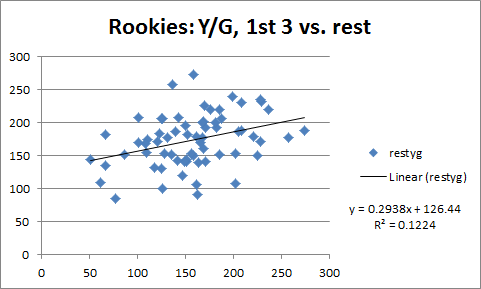
Here’s rookie QB’s YPG over their first 3 starts [actually, it’s games played, not started—my bad] vs. their YPG for the rest of the season (min 8 starts total):

And here’s the table of rookies through Dan Marino (who I thought would have been higher):

Cam Newton, of course, has 1012 through his first 3.  And in game 4 he has already passed Vinny Testaverde’s production for the rest of his rookie season.

[At the conclusion of the game] Newton now has 1386 yards, which is the record for a rookie through his first four games (previously held by Marc Bulger with 1149).  The record through five is 1496, so he’s likely to break that.  Through six is 1815, so that’s not a sure thing, but through seven is also 1815 (Bulger only played 6 games, and the next highest total through seven is 1699).  But there’s still a lot of variance to be navigated between now and [Peyton] Manning’s full-season record of 3739.


10/2 NFL Sunday Live Blog

Here we go again.  Details here.  Please leave comments about anything you want and I’ll do my best to give thorough responses.

Getting DirecTV Monday but having to wait until today to use Sunday Ticket has been like waiting to open a Christmas present I bought myself.

10:00: Tough to pick a game with the Panthers, Lions, Steelers, and Bills games all having surprisingly interesting story-lines, so I’m going to stick with the Red Zone Channel for a few.

10:07: OK, I didn’t know this was humanly possible, but I think RZC is too ADD for me, so I’m going to switch to the Panthers game.

10:11: I wonder what qualities on teams are most likely to lead to successful rookie campaigns.  And given that successful rookie campaigns tend to fizzle out in future years, do those same things perhaps correlate negatively with long-term success?

10:18: Ugh, breast cancer awareness.  Am I the only one that finds the breast cancer pandering to be a little insidious?  It’s politically an easy cancer to go with, and has cross-gender appeal, but it’s already over-funded relative to its prevalence and mortality rates.  See this slightly out-of-date NYTimes article: Lung Cancer receives $1,630 research dollars per death, and Breast Cancer receives $13,452.

Maybe lung cancer is politically toxic b/c it’s seen as the smoker’s curse, but Colon cancer kills more people and gets 1/3 the funding.  But it wouldn’t be nearly as sexy to wear brown “Colon Cancer Awareness” ribbons.

10:25: Ok, 20 minutes and no graphs, I know, derelict.

10:35: Ok, this was an idea that turned out approximately how I expected.  This is Win Percentage Added per Game on the X-axis and Attempts and Completion percentage on the Y-axes:
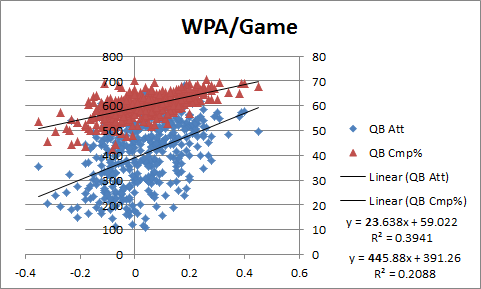
The interesting part is that attempts has a higher relative slope, but completion percentage has a better R-squared.  In other words, completion percentage is more reliable, but less indicative.

10:42: Google search that just led to the blog: “should I start Michael Vick over Cam Newton today.”  Welcome, fantasy footballer!  And sorry, I have no idea.  I don’t play fantasy football anymore: it’s pleasantly time consuming and has near-infinite depths for analysis, but the overlap with analysis of things that matter is way too small.

11:02: More on Cam Newton.  Here’s rookie QB’s YPG over their first 3 starts vs. their YPG for the rest of the season (min 8 starts total):
11:18: Here’s the table of rookies through Dan Marino (who I thought would have been higher):
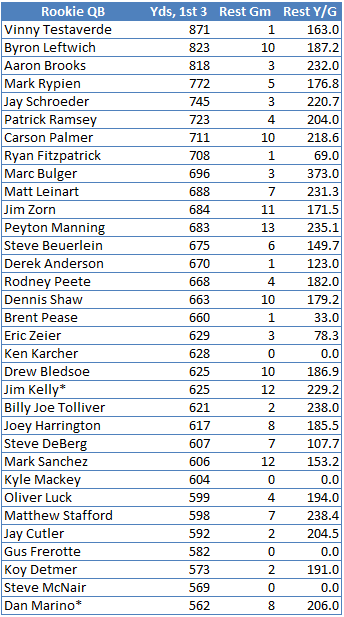
Cam Newton, of course, has 1012 through his first 3.  And in game 4 he has already passed Vinny Testaverde’s production for the rest of his rookie season.

11:22: Oops, I apologize.  The above counts games played by rookie quarterbacks, not just games started.

11:30: Reliable blog-fan Matt comments:

I’m watching Redskins-Rams right now, and they just called a personal foul on a punt coverage player for “hitting a defense-less receiver,” as he pummeled the punt returner just as the returner caught the ball. He did not hit him prior to the ball being caught.

Now, I’m sure the officials are properly applying the rule. But this has to be a dumb rule, right? This is why we have the fair-catch rule. To me, as long as the hit is clean (i.e. not helmet-helmet, etc.) and you don’t hit him prior to him touching the ball, this rule is unnecessary. (Note that this is different than hitting a defenseless receiver on a pass play over the middle; he can’t declare (or not declare) a fair catch.

I didn’t see the play, but I’m not sure I entirely agree, at least as a theoretical matter.  I can imagine there being a scale for how “unnecessarily rough” a hit is relative to how defenseless the target is.  But, yes, I agree that there is a bit of discord between this approach and the fair catch rule, which is basically a completely objective but much more crude way of addressing the same issue.

11:35: Broadly, I think the league is moving away from the “brutality” of violence and more toward the “finesse” of passing.  I imagine that (in addition to protecting the players, blah, blah) they think they’re giving the fans what they want.  But I don’t know.  As an aesthetic matter, I think people are more mesmerized by the “finesse” side of the game, but possibly without realizing that a good chunk of its beauty comes from the contrast.

11:39: Ok, getting long enough that I’m switching to the split format that seemed to work last week.

11:50: A friend on IM:

Friend [11:40 AM]: i think people realize they like the contrast

Friend [11:40 AM]: i doubt there are numbers for it, but i’ve heard anecdotes about training camp attendance

Friend [11:41 AM]: and how it sharply increases when full pads

I at least partly agree.  The typical fan knows that they like the violence, though I’m not sure they understand how the two sides enhance each other.  And I’m not sure that the league understands this either.  I think they probably see it a matter of addition: for example, say it used to be 40 utils of pleasure from finesse and 40 utils of pleasure from violence, for 80 total.  They believe that if they can sacrifice 20 utils of violence for 25 of finesse, they’ll have upped the total utility to 85.  But if the total aesthetic utility corresponds to the product of the two values, they would have actually reduced the value from 1600 (40*40) to 1300 (65*20).

12:09: Matt asks:

Anyway, I wanted to pose you a question regarding time management. Skins complete pass on 2nd down, setting up 3rd and 2, from their own 28, with about 1:20 to play. Neither team calls a timeout. That could very well be correct, but I assume similar situations are ripe for poor decision making. (i.e. if it’s 3rd and 17, Rams definitely call TO; if the ball is at the 48, Skins probably call timeout). Any thoughts / empirical work you’ve done/seen on this?

Yes, I’ve looked into it some.  The situational analysis is sticky and hard to generalize, but the main thing to note is that any time it has a significant effect, one of the two teams will usually have the incentive to take the timeout, at least somewhere within the given sequence of downs (unless the value of keeping it is greater).

In this situation, the Redskins gain little by taking the timeout, since letting the clock run down and keeping it for later is virtually equivalent with 1:20 left, the marginal difference to their scoring chances isn’t huge, and the bigger risk to them is giving St. Louis too much time.  Conversely, the Rams prob should take it.  Take a look at this old link about two minute drills for some relevant stats.

12:29: Random stat from my PBP database:  For home teams, 19% of drives starting with a kickoff end in a touchdown, for away teams, just under 17%.

12:39: But on the first drive of a game, home teams score TD’s on 22%, away teams just 16%.

12:56: Sorry I’m so slow this morning.  It’s not slacking, I’ve been playing around with some PBP data relating to Matt’s question above, and any time I start wading through PBP stuff, I get easily distracted.  There’s something new and fascinating around every corner!

1:11: OK, here’s what should be considered a pretty basic graph, but it has some interesting subtleties to it:
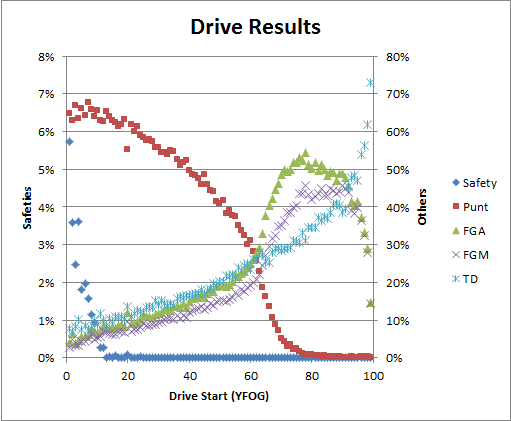
Comment to follow.

1:24: One of the interesting things about this graph is what’s going on in the first 20 yards:
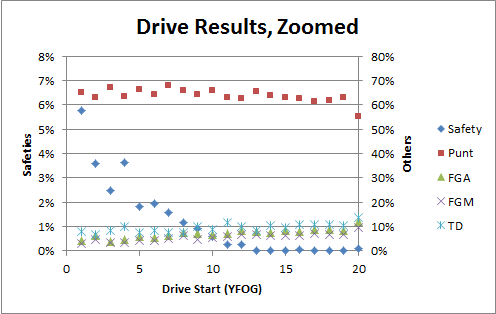
So what’s interesting about this? Well, that aside from safeties, these particular results are very linear.  I think many people would expect that being backed into your endzone makes executing your offense a lot harder — but aside from the occasional safety, the outcomes are really no worse than what you would expect from just being more yards back (turnovers aren’t shown b/c of data mashing issues, but there’s not a massive jump for them either).

1:35: Of course, the other important factor:
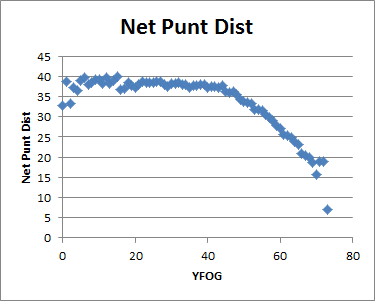
And, the corresponding graph limited to your own 20:
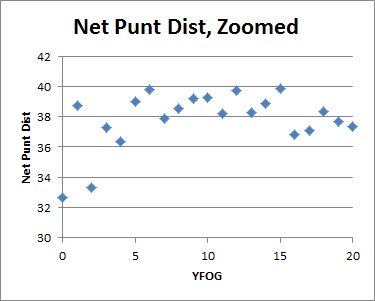
1:41: Grabbing lunch, back in a few.

1:44: Bill Simmons tweets:

sportsguy33

The Cowboys really need to fire Wade Phillips. This has dragged on far too long.

20 minutes ago

Ha!  I Think the NFL Coach with the longest tenure at the moment is Jerry Jones Puppet X.

2:09: So the take-homes from the above graphs are that the situation gets significantly better/worse within the 5 yard line, accelerating as you approach the goal line.  This is why kicking field goals from the 1 is terrible even in situations where it has some tactical benefit.  Obv this is nothing new to anyone even slightly informed about “expected value” in football (it’s basically the prototypical example), but to break it down clearly: If you don’t score on your 4th down play, trapping your opponent in that spot is valuable 4 ways:

  1. Natural field position advantage vs. giving your opponent the ball on the 20 after a made field goal.
  2. Significantly increased chance of a safety.
  3. Increased chance of good field position b/c of short opponent punts.
  4. Your subsequent field position also starts to hit the increasing part of your Touchdown/Expected Points curve (i.e., it has value in addition to the generic value of better expected field position).

Though it should be noted that the last 3 effects are much stronger on the 1 than on the 5.

2:16: After Red Zone Channel-ing it for a while, I’m switching to the New England game.

2:17: This is odd: Traffic for the live blog is up from last week, but commenting is down.  Come on, people!

2:25: So these Sunday Ticket “Short Cuts” are pretty sweet: They’re 30 minute versions of each game that include every play and no filler.  But their utility is limited by the fact that they just cut up the original sound track and don’t have any new commentary or any other way of identifying who is involved in each play: About half the time, the commentators get cut off before saying who the runner or receiver was. At the very least, they should scroll the play-by-play along the bottom.

Also, while it might make the vids slightly longer, they should take at least a moment to dwell on the particularly big or important plays: It’s weird when there’s like a 60 down touchdown pass, then bam!, extra point, kickoff, etc. Show a few replays!  Not only is it more fun that way, but they contain important information.

2:51: Random thought: There’s a pretty simple pattern of where analytics has and hasn’t been adopted in sports: it has been adopted in spots where decision-makers can blame other people for having been wrong all along, and it hasn’t been adopted in places where decision-makers would have to blame themselves.

2:59: Congrats to the Lions, but with apologies to Nate, there’s at least one good reason to root against Detroit: If they end up going to—or, god forbid, winning—the Super Bowl, the stories about the recession/auto industry recovery and the Lions being the main source of hope for a struggling community, etc., may be even more insufferable than the litany of identical stories we had with New Orleans.

3:12: More on the “random thought” above: So the sport of baseball has no problem with the Moneyball movie, I’m sure, b/c who are portrayed as the stupid ones: The nameless, decrepit, curmudgeonly old scouts in the basement? The faceless, nameless, obnoxious talk radio hosts and listeners? The only baseball execs we see are 1) the Oakland ownership, who tell Beane to do what he’s got to do, 2) the Cleveland management, who, for some unknown reason, listen to this lackey analyst that they supposedly disrespect, and 3) the glorious, heartwarming Red Sox.  Even the “clueless” manager really only has one major dispute: whether to start Peña (an All-Star) or Hatteburg at 1st base, which is ultimately portrayed as a near-push anyway.

3:19: And within the sport of Baseball, look at where analytics has been most embraced: 1) Player evaluation—something it is easy to blame others for (as above).  And 2) High-granularity pitching and batting stats (location, etc), which are just an advancement in technology, and not having them before was no-one’s fault.  And where has it been rejected and ignored?  Strategic decisions!  Teams still steal too much, bunt too much, they’re still stuck on archaic pitching rotation strategy (e.g., Mariano Rivera should either be pitching more innings or more important innings: the way he is used is demonstrably inefficient), etc. And who is responsible for having gotten those wrong for so long? The same people who are in position to accept or reject new approaches!

3:43: So the most exciting game going atm is Giants/Cardinals—ugh.  I did mention I’ll try to answer almost any question, right? Aren’t there any Dennis Rodman haters out there who can give me something more interesting to talk about than Eli Manning’s mediocrity?

3:46: Even with the New England’s defensive problems, I think my generic “Patriots vs. Whoever Was The Best Team in the NFC Last Season” Super Bowl pick is looking pretty decent right now.

4:16: In support of last night’s screed, especially the claim that “[MLB] games are either not important enough to be interesting (98% of the regular season), or too important to be meaningful (100% of the playoffs),” here’s a graph I made to illustrate just how silly the MLB Playoffs are:
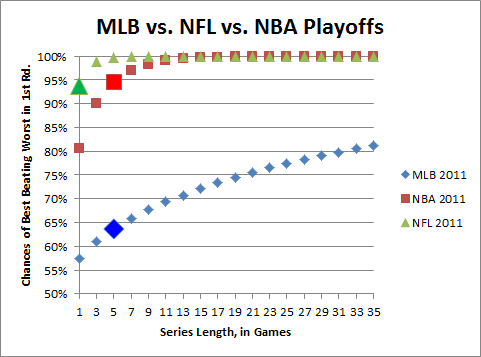
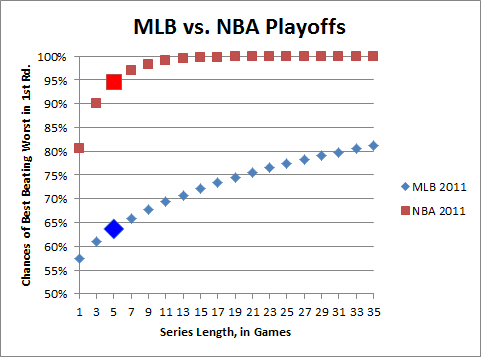
4:30: Not counting home-field advantage (which is weakest in baseball anyway), this represents the approximate binomial probability of the team with the best record in the league winning a series of length X against the playoff team with the worst record going in.  The chances of winning a game are approximated by taking .5 + better win percentage – worse win percentage (note, of course, the NFL curve is exaggerated b/c of regression to the mean: a team that goes 14-2 doesn’t won’t actually win 88% of their games against an average opponent. But they won’t regress nearly enough for their expectation to drop anywhere near MLB).  The brighter and bigger data points represent the actual 1st round series lengths in each sport.

By this approximation, the best team against the worst team in a 1st round series (using the latest season’s standings as the benchmark) in MLB would win about 64% of the time, while in the NBA they would win ~95% of the time.  To win 2/3 of the time, MLB would need to switch to a 9 game series instead of 5; and to have the best team win 75% of the time, they would need to shift to 21 (for the record, in order to match the NBA’s 95% mark, they would have to move to a 123 game series.  I know, this isn’t perfectly calculated, but it’s ballpark accurate).  I like the fact that the NBA and NFL postseasons generally feature the best teams winning.

Moreover, in a sense, it also makes upsets more meaningful: since the math is against “true” upsets happening often, an apparent upset can be significant: it often indicates—Bayes-wise (ok, if that’s not a word, it should be)—that the upsetting team was actually better.  In baseball, an upset pretty much just means that the coin came up tails.

4:42: Adam asks:

In the MLB vs. NFL vs. NBA Playoffs graph, the chances of best beating worst in first round for NFL for a 1 game series is almost 95%.

Looking at the odds to this week’s NFL games, the biggest favorite was GB verses Denver and they were only an 88% chance of winning by the money line (-700). Denver is almost certainly not a playoff team, so it’s tough to imagine an even more lopsided playoff matchup that could get to 95%. What am I missing?

I sort of addressed this in my longer explanation, but you’re not missing anything: the football effect is exaggerated (but the reality still doesn’t drop anywhere near baseball). First off, to your specific concern, this early in the season there is even more uncertainty than in the playoffs.  But second, and more importantly, this method for approximating a win percentage is less accurate in the extremes, especially when factoring in regression to the mean (which is a huge factor given the NFL’s very small sample sizes).  Maybe I’ll update the math tonight or tomorrow, but even this crude demonstration should be sufficient proof of the point.

4:52: In fact, the regression to the mean effect in the NFL is SO strong, that I think it helps explain why so many Bye-teams lose against the wild-card game winners (without having to resort to “momentum” or psychological factors for our explanation).  By virtue of having the best records in the league, they are the most likely teams to have significant regression effects.  That is, their true strength is likely to be lower than what their records indicate.  Conversely, the teams that win in the bye week (against other playoff-level competition), are, from a Bayesian perspective, more likely to be better than their records indicated.  Think of it like this: there’s a range of possible true strength for each playoff team: when you match two of those teams against each other (in the WC round), the one who wins might have just gotten lucky, but that particular result is more likely to occur when the winning team’s actual strength was closer to the top of their range and/or their opponent’s was closer to their bottom.

In fact, I’ve looked at this before, and it’s very easy to construct scenarios where WC teams with worse records have a better projected strength than Bye teams with better records.  Factor in the fact that home field advantage actually decreases in the playoffs (it’s a common misconception that HFA is more important in the post-season: adjusting for team quality, it’s actually significantly reduced—which probably has something to do with the post-season ref shuffle: see section on ref bias in this post), and you have a recipe for frequent upsets.

4:55: In retrospect, I probably should have just left the NFL out of that graph.  Basketball makes for a much better comparison:
4:59: Arturo tweets:

ArturoGalletti

Safe to say at this point, Phillip Rivers is << than Drew Brees

Man, it’s like I KNOW Brees is awesome, sort of, but I still have lingering doubts that a 6-foot tall QB can really be that good.  I mean, I feel like a bigot, but I’ve looked at the math over and over again, and he’s such a massive outlier that I can’t let it go.

5:11: WTF? With the latest Firefox update, I can no longer drag tabs left and right.  Did Mozilla hire the Netflix web design team or something?

5:12: “Don’t kick it to Devin Hester.”  Man, can we please retire this stupid observation?  He has 12 return touchdowns.  In 6 years.

5:32: Ok, I’m not finding the 12 number they’re mentioning, but Hester has 11 TD on 182 punt returns and has averaged 12.6 yards per return.  This is obviously excellent, but please: the average punt return is 8.1 yards.  What is the cost of punting away from Hester?  It’s not like this is a free proposition.  Hint: it’s probably more than 4.5 yards.  And you know who else scores touchdowns? Teams with better field position.

5:37: I hate the new Facebook.  I mean, I wasn’t the biggest fan before.  But it’s like they took every thing I hated about it and multiplied them each by 10.  Unrelatedly, don’t forget sign up for updates on the Skeptical Sports Analysis Facebook page!

5:41: I think I’m addicted to scatterplots. <— new contender for nerdiest thing I’ve ever thought in earnest.

5:47: Earlier, from IM, re: rule changes protecting “defenseless” players:

Friend [11:45 AM]: probably don’t do very much to actually protect players

Friend [11:47 AM]: wouldn’t it be much more effective just to mandate equipment changes?

Friend [5:44 PM]: also, it would eliminate the alleged bias in those calls

So, the answer to this is so obviously “yes” that I’m interested in the second-order questions: 1) WTF is going on behind the scenes that has prevented this from happening? 2) What are the ulterior motives that we don’t know about—both on the owners’ and players’ sides?

5:52: Collinworth just said that we’ve seen more returns from deep in the endzone this season than ever before.  First, I don’t know if that’s just his observation or if it’s based on actual stats.  Second, even if it is based on real stats, I don’t know if he means in raw numbers or percentages—obv the first would be expected from the kickoff change.  But—and it’s a big but—if teams actually were returning a higher percentage of kicks from deep in the endzone, wouldn’t THAT be interesting?

6:36: Can I interrupt this blog to say that I love my wife?  Not only is she a great person, and a successful Harvard/Stanford educated lawyer, but she makes great spaghetti.  Anyway, back from dinner.  Working on a couple more graphs.

6:42: By the way, please email me any suggestions, ideas or opinions (positive or negative) you have about this live blog.  Would you like to see more in-game analysis instead of game-inspired musing? More strict football and fewer tangents? More and broader tangents? More frequent and shorter updates or less frequent and more detailed?  Etc. I kind of love doing it, so I’m set on it being a regular feature, and I’d obv like to do it the right way.

7:03: Cam  Newton now has 1386 yards, which is the record for a rookie through his first 4 games (previously held by Marc Bulger with 1149).  The record through 5 is 1496, so he’s likely to break that one.  Through 6 is 1815, so that’s not a sure thing, but through 7 is also 1815 (Bulger only played 6 games, and the next highest at 7 is 1699).  But there’s still a lot of variance to be navigated between now and Manning’s full-season record of 3739.

7:10: Aaron Schatz tweets:

FO_ASchatz

With all the wacky comebacks in the NFL this year, does anyone really want to write off the Jets this early?

1 minute ago

I’m sure he’s kidding, but I’m not sure “wacky comebacks” correlate much with “wacky comebacks.”  Of course, a higher league-wide emphasis on passing will prob lead to more “comebacks” by previous standards: that is, games may be extended, there may be more turnovers, and trailing teams may have greater capability to catch up.  But eventually this should just lead to a stasis where our perception of “wacky” changes: If a team has 10% chance of winning, they have a 10% chance of winning, whether that 10% means being behind 10 or being behind 20.

That said, under current league conditions, I’d say a 13 point lead definitely isn’t sufficient to “write off” any team that wasn’t DOA already.

7:33: Why does everyone call Romo “electrifying”?  He had some “big” numbers on an offensive team, but what’s the evidence that any of that was his doing?  Has he ever given the impression that he was doing more with his team than other quarterbacks would have?

7:39: Crap, my Excel just crashed and killed at least 15 minutes of work.  Maybe not the best time to write my “Ode to spreadsheet software.”  Though seriously, present resentments aside, isn’t Excel pretty much the best program ever?

7:42: And what the heck is it doing when it says “Excel is trying to recover your information.  This may take several minutes.”  This is a new(ish) computer.  Nothing takes several minutes.

7:46: Matt notes:

I was just able to use the drive expectancy chart to check on a Chris Collinsworth comment, love all the graphs and tools. BTW the comment was about the value of getting the ball on the 2-3 vs the half yard line, if I read the graph right the odds of a safety double at the 1 yard line vs the three yard line. Still only 6% but a big enough difference to care.

Yes, there’s a significant difference between the two, and it gets more and more dramatic the closer you get to the plane: there’s a pretty significant difference from being at the 1 and being at the 1/2, etc.  It’s also true on the other side of the field: all kinds of wacky things happen as you approach the Endzone, and they’re not all intuitive.

In fact, one of the big difficulties with building a WPA model is accounting for these kinds of situations empirically, because 1) they behave abnormally, and 2) they’re either rare (e.g., being right at your own end zone), or extremely specific (e.g., some of the things that happen around the 11-12 yard line in the Red Zone), and thus have some of the smallest sample sizes for observation.

7:51: Matt also asks:

[I]n your salary research were there any trends dealing with the distribution of the players salary? Do winning teams generally have alot of average-paid players(The old New England Patriot teams) or alot of high paid elite players(Maybe the Colts? Cowboys? Not even sure what teams what qualify under this distinction.)

Yeah, this is actually closer to the main thing I’m interested in: E.g., what’s the most successful salary distribution profile?  If you didn’t notice, the salary graph I posted last week actually has “Salary Standard Deviation” as a variable, so that gets at your question a little: Yes, it’s one of the most predictive indicators.  However, a lot of that comes from quarterbacks: Since a few great quarterbacks (or at least quarterbacks on already-great teams) get enormous salaries, they’re kind of like automatic outliers.

8:20: So, back to what I was working on before my Excel crashed: With all the turnovers in this game, there’s about a 100% chance that commentators later will talk about the importance of “turnover differential.”  People always rattle off a bunch of stats about how the team that wins the “turnover battle” almost always wins the game (like, duh), with the intention of reminding everyone how terrible it is to take the kinds of risks that lead to turnovers.

But this causation goes both ways: Turnovers can obviously cause teams to lose, but teams losing also cause turnovers.  When you’re behind, you have to take risks to have any chance of winning. Citing the “turnover battle” stats without context is about as ridiculous as citing the “team X is 43-1 when having a 100 yard rusher.”

8:28: What goes unmentioned in all of this is “punt differential.” [Punts also involve turning the ball over.] Guess what? This stat is ALSO highly predictive of game outcomes, but without as much causation baggage: When teams are behind, they are actually forced to punt less.  Despite the completely routine nature of punts vs. the extreme nature of turnovers, “punt differential” holds its own with “turnover differential” in a logistic regression to Win% (n=5308):
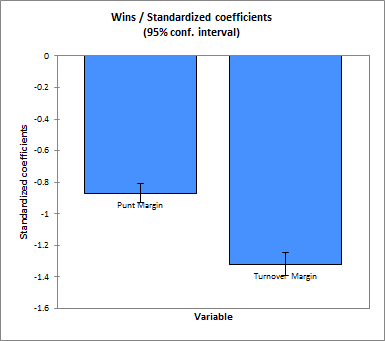
8:31: If you do run this as a linear regression to point differential, it gets even closer (I should also note, if you do your regression to “outside” games, punt differential is actually more predictive, but this is because it is much more reliable).

8:41: A fun metric that I love (and believe to be very useful) is “punts plus turnovers,” or PUPTO:
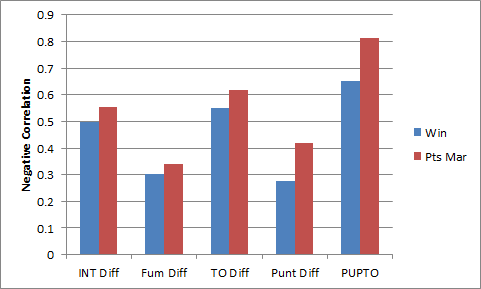
8:45: A pretty interesting thing to note in this chart is the difference between the predictivity of Interception differential vs. Fumble differential:  from a pure “Turnovers=Bad” perspective, this is counter-intuitive: After all, many interceptions take place down-field, while fumbles typically happen at the line of scrimmage (also, I haven’t checked, but I feel like a disproportionate number of fumbles are returned for touchdowns).  My suspicion is that this difference is at least partly explained by what I described earlier: When teams are losing, they have to take a lot of risks that lead to more interceptions, but they don’t take a lot of risks that lead to more fumbles.

8:51: Anyway, not seeing any more questions, I’m going to take off a few minutes early.  Hope you enjoyed my blogging today, and I apologize for the technical difficulties.  Cya.

Live Blog Tomorrow, Plus: Why Baseball and I Are, Like, Unmixy Things

As a friend of mine put it, “Posts merely announcing something are pretty lame,” so before I announce tomorrow’s event, let me explain why I will NOT be live-blogging any of tomorrow’s baseball games:

It’s a constant source of guilt for me that I don’t like baseball more, but I can’t help it: To me, the games are either not important enough to be interesting (98% of the regular season), or too important to be meaningful (100% of the playoffs).  That said, I still dabble in baseball analysis myself, and I certainly understand the statistical appeal: the data-sets are huge, the variables are mostly independent, and—even in a post-Moneyball world—the screw-ups are ample.

I have many baseball-loving friends, and talking to them about this subject almost always goes like this exchange from Buffy the Vampire Slayer (with appropriate substitutions, and minus the sexual undertones):

[Me]: [Baseball?]

[Every Baseball Fan Ever]: Yeah.

[Me]: You seriously [watch baseball] for fun?

[Fan]: Well, not [minor leagues] or anything, but yeah. Don’t you?

[Me]: Actually, [no leagues] is more my specialty. I’m an avid [non-baseball watcher].

[Fan]: You’re kidding, right? I mean, you know how to [watch baseball]..

[Me]: Well, I took the class.. [Baseball] and [I] are, like .. un-mixy things.

[Fan]: It’s just because you haven’t had a good experience yet. You can have the best time [watching baseball].  It’s not about getting somewhere.  You have to take your time.  Forget about everything.  Just.. relax.  Let it wash over you.  The air..  motion..  Just, let it roll.

[Me]: We are talking about [baseball], right?

I also don’t entirely believe the hype about it being such an integral part of our national heritage, and I think that perception today has been influenced heavily by nostalgia from influential people like George Will and Ken Burns, and I posted a graph somewhat supportive of that a while back:

image

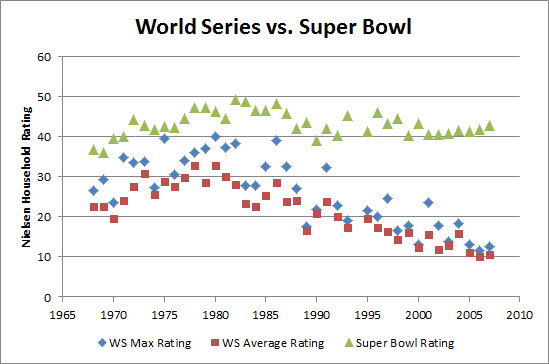
Note also that the NFL’s relative popularity vs. MLB is nothing new.  Here is a year-by-year plot showing the World Series ratings vs. Super Bowl ratings:

Since it’s inception, the Super Bowl has beaten even the highest-rated World Series game every single year (recently, it has even been beating the entire series combined for total viewers).

OK, so with that out of the way: Once again, I’ll be live-blogging NFL Sunday from 10am until the final whistle tomorrow—now powered by NFL Sunday Ticket!  Here’s the explanation, and here’s last week’s end product.