[Update: This post from 2010 has been getting some renewed attention in response to Randy Moss’s mildly notorious statement in New Orleans. I’ve posted a follow-up with more recent data here: “Is Randy Moss the Greatest?” For discussion of the broader idea, however, you’re in the right place.]
As we all know, even the best-intentioned single-player statistical metrics will always be imperfect indicators of a player’s skill. They will always be impacted by external factors such as variance, strength of opponents, team dynamics, and coaching decisions. For example, a player’s shooting % in basketball is a function of many variables – such as where he takes his shots, when he takes his shots, how often he is double-teamed, whether the team has perimeter shooters or big space-occupying centers, how often his team plays Oklahoma, etc – only one of which is that player’s actual shooting ability. Some external factors will tend to even out in the long-run (like opponent strength in baseball). Others persist if left unaccounted for, but are relatively easy to model (such as the extra value of made 3 pointers, which has long been incorporated into “true shooting percentage”). Some can be extremely difficult to work with, but should at least be possible to model in theory (such as adjusting a running back’s yards per carry based on the run-blocking skill of their offensive line). But some factors can be impossible (or at least practically impossible) to isolate, thus creating systematic bias that cannot be accurately measured. One of these near-impossible external factors is what I call “entanglement,” a phenomenon that occurs when more than one player’s statistics determine and depend on each other. Thus, when it comes to evaluating one of the players involved, you run into an information black hole when it comes to the entangled statistic, because it can be literally impossible to determine which player was responsible for the relevant outcomes.
While this problem exists to varying degrees in all team sports, it is most pernicious in football. As a result, I am extremely skeptical of all statistical player evaluations for that sport, from the most basic to the most advanced. For a prime example, no matter how detailed or comprehensive your model is, you will not be able to detangle a quarterback’s statistics from those of his other offensive skill position players, particularly his wide receivers. You may be able to measure the degree of entanglement, for example by examining how much various statistics vary when players change teams. You may even be able to make reasonable inferences about how likely it is that one player or another should get more credit, for example by comparing the careers of Joe Montana with Kansas City and Jerry Rice with Steve Young (and later Oakland), and using that information to guess who was more responsible for their success together. But even the best statistics-based guess in that kind of scenario is ultimately only going to give you a probability (rather than an answer), and will be based on a miniscule sample.
Of course, though stats may never be the ultimate arbiter we might want them to be, they can still tell us a lot in particular situations. For example, if only one element (e.g., a new player) in a system changes, corresponding with a significant change in results, it may be highly likely that that player deserves the credit (note: this may be true whether or not it is reflected directly in his stats). The same may be true if a player changes teams or situations repeatedly with similar outcomes each time. With that in mind, let’s turn to one of the great entanglement case-studies in NFL history: Randy Moss.
I’ve often quipped to my friends or other sports enthusiasts that I can prove that Randy Moss is probably the best receiver of all time in 13 words or less. The proof goes like this:
Chad Pennington, Randall Cunningham, Jeff George, Daunte Culpepper, Tom Brady, and Matt Cassell.
The entanglement between QB and WR is so strong that I don’t think I am overstating the case at all by saying that, while a receiver needs a good quarterback to throw to him, ultimately his skill-level may have more impact on his quarterback’s statistics than on his own. This is especially true when coaches or defenses key on him, which may open up the field substantially despite having a negative impact on his stat-line. Conversely, a beneficial implication of such high entanglement is that a quarterback’s numbers may actually provide more insight into a wide receiver’s abilities than the receiver’s own – especially if you have had many quarterbacks throwing to the same receiver with comparable success, as Randy Moss has.
Before crunching the data, I would like to throw some bullet points out there:
- There have been 6 quarterbacks who have started 9 or more games in a season with Randy Moss as one of their receivers (for obvious reasons, I have replaced Chad Pennington with Kerry Collins for this analysis).
- Only two of them had starting jobs in the seasons immediately prior to those with Moss (Kerry Collins, Tom Brady).
- Only one of them had a starting job in the season immediately following those with Moss (Matt Cassell).
- Pro Bowl appearances of quarterbacks throwing to Moss: 6. Pro-Bowl appearances of quarterbacks after throwing to Moss: 0.
- Daunte Culpepper made the Pro Bowl 3 times in his 5 seasons throwing to Moss. He has won a combined 5 games as a starting quarterback in 5 seasons since.
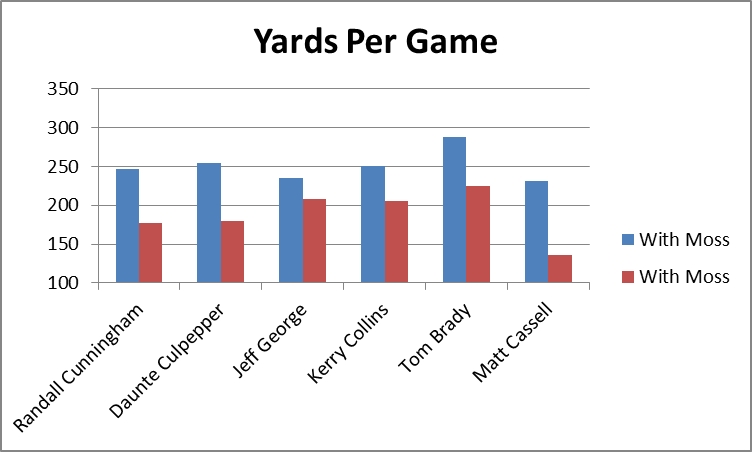
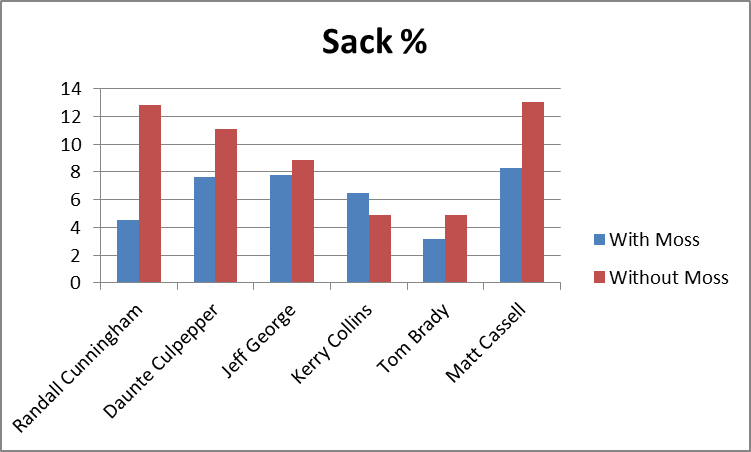
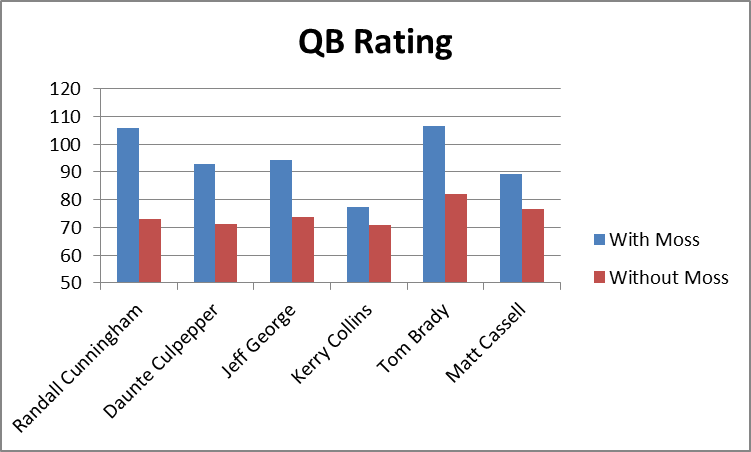
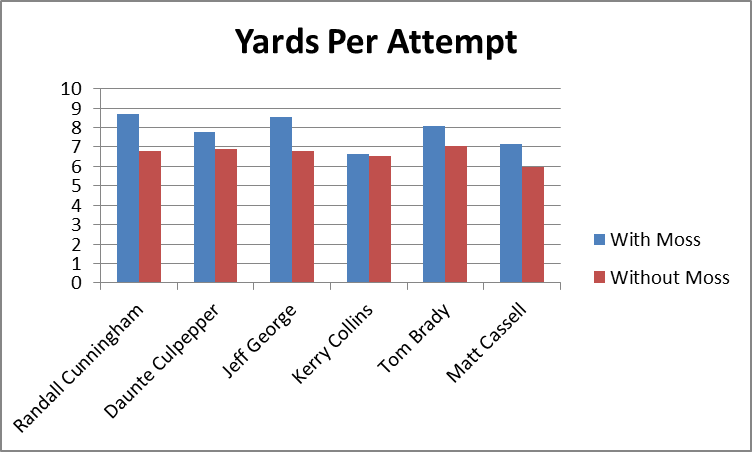
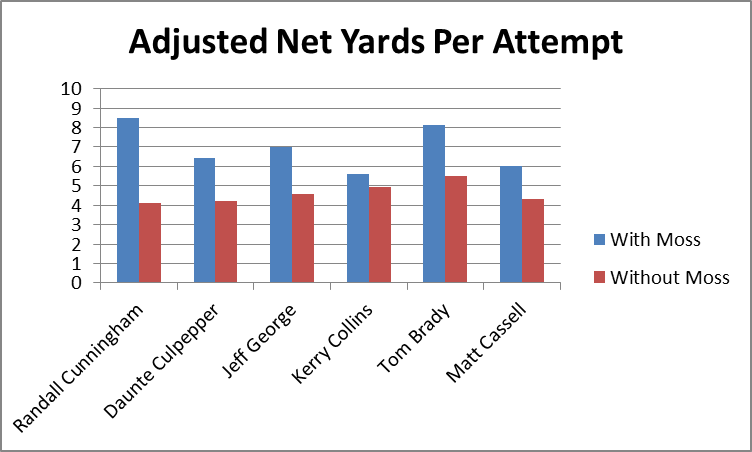
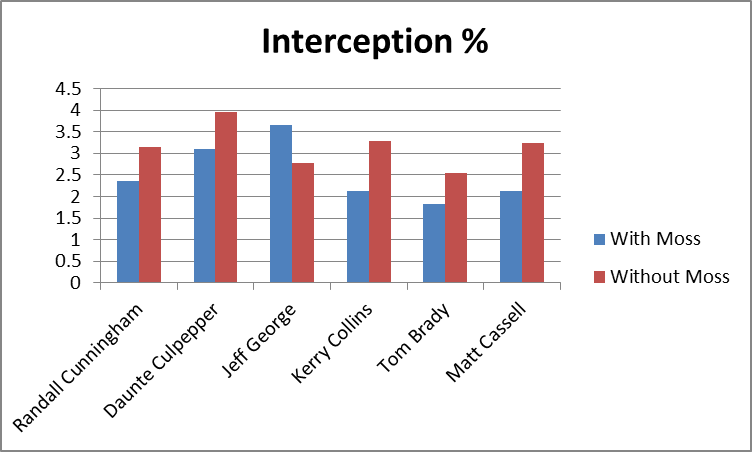
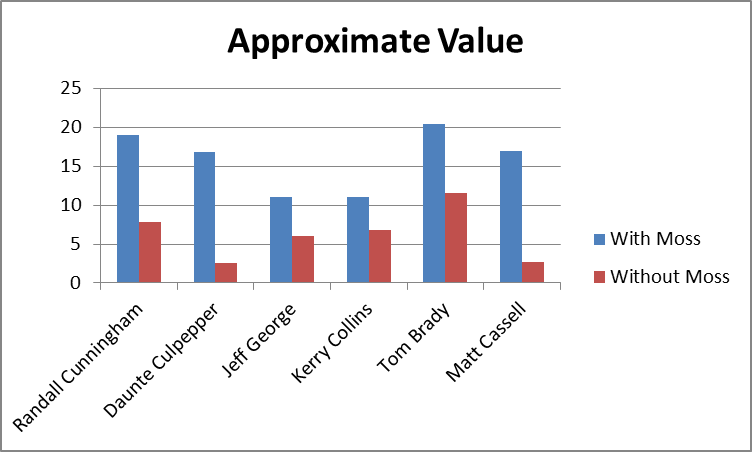
With the exception of Kerry Collins, all of the QB’s who have thrown to Moss have had “career” years with him (Collins improved, but not by as much at the others). To illustrate this point, I’ve compiled a number of popular statistics for each quarterback for their Moss years and their other years, in order to figure out the average affect Moss has had. To qualify as a “Moss year,” they had to have been his quarterback for at least 9 games. I have excluded all seasons where the quarterback was primarily a reserve, or was only the starting quarterback for a few games. The “other” seasons include all of that QB’s data in seasons without Moss on his team. This is not meant to bias the statistics, the reason I exclude partial seasons in one case and not the other is that I don’t believe occasional sub work or participation in a QB controversy accurately reflects the benefit of throwing to Moss, but those things reflect the cost of not having Moss just fine. In any case, to be as fair as possible, I’ve included the two Daunte Culpepper seasons where he was seemingly hampered by injury, and the Kerry Collins season where Oakland seemed to be in turmoil, all three of which could arguably not be very representative.
As you can see in the table below, the quarterbacks throwing to Moss posted significantly better numbers across the board:
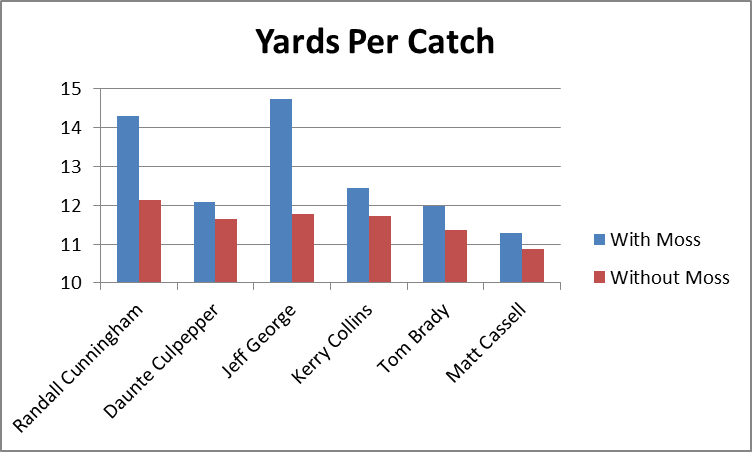
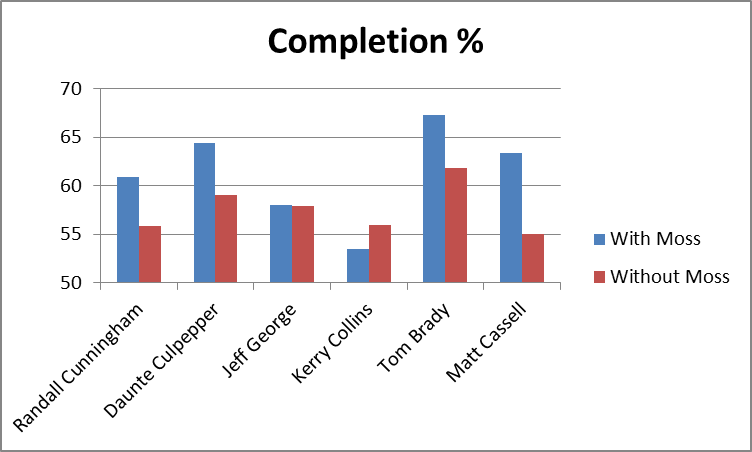
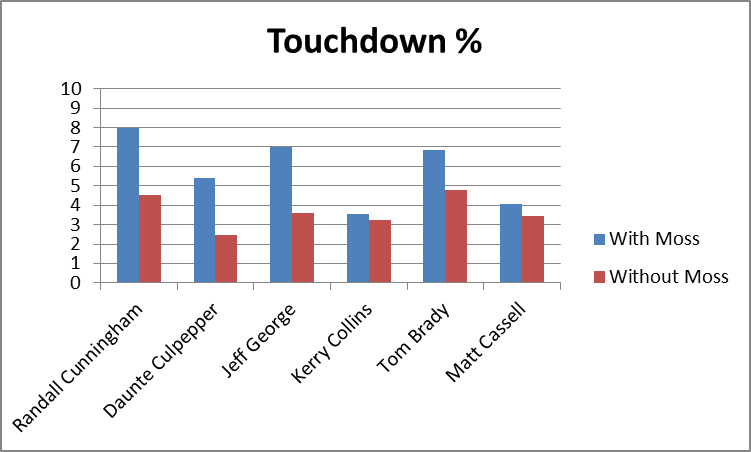
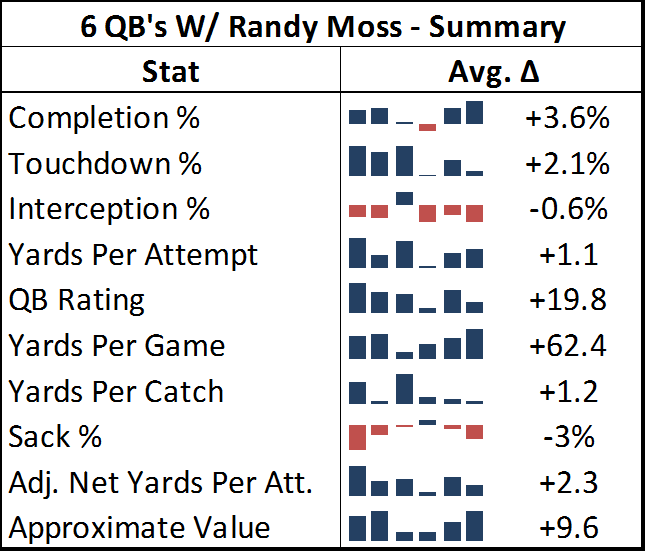 [Edit to note: in this table’s sparklines and in the charts below, the 2nd and third positions are actually transposed from their chronological order. Jeff George was Moss’s 2nd quarterback and Culpepper was his 3rd, rather than vice versa. This happened because I initially sorted the seasons by year and team, forgetting that George and Culpepper both came to Minnesota at the same time.]
Note: Adjusted Net Yards Per Attempt incorporates yardage lost due to sacks, plus gives bonuses for TD’s and penalties for interceptions. Approximate Value is an advanced stat from Pro Football Reference that attempts to summarize all seasons for comparison across positions. Details here.
Out of 60 metrics, only 3 times did one of these quarterbacks fail to post better numbers throwing to Moss than in the rest of his career: Kerry Collins had a slightly lower completion percentage and slightly higher sack percentage, and Jeff George had a slightly higher interception percentage for his 10-game campaign in 1999 (though this was still his highest-rated season of his career). For many of these stats, the difference is practically mind-boggling: QB Rating may be an imperfect statistic overall, but it is a fairly accurate composite of the passing statistics that the broader football audience cares the most about, and 19.8 points is about the difference in career rating between Peyton Manning and J.P. Losman.
Though obviously Randy Moss is a great player, I still maintain that we can never truly measure exactly how much of this success was a direct result of Moss’s contribution and how much was a result of other factors. But I think it is very important to remember that, as far as highly entangled statistics like this go, independent variables are rare, and this is just about the most robust data you’ll ever get. Thus, while I can’t say for certain that Randy Moss is the greatest receiver in NFL History, I think it is unquestionably true that there is more statistical evidence of Randy Moss’s greatness than there is for any other receiver.
Full graphs for all 10 stats after the jump:
Wow really great stuff. I’ve been trying to apply some of the same techniques you’ve used here to determine just how important Darrelle Revis is to the JETS’ secondary. As you’ve probably seen, they’re allowing something like 130 yds/gm on average more this year than last year through the air. While Rex’s system certainly can be attributed somewhat to the strength of the defense (jumped from 18th in the league to 1st with defensive additions of Jim Leonhard, Bart Scott, and Marques Douglas… that’s gotta be a system thing), the stats from this year clearly show that the success of the secondary as a whole has at least some dependence on Revis being back there (entanglement, as you put it). My problem is that there are just so many other variables in play (with Revis out, Leonhard is the only starter still back there… argh) and it’s difficult to quantify anything without a larger sample size. I suppose I’ll just have to wait and see how the defense improves from week to week, but do you have any suggestions for metrics I should be looking at?
Hi Zaf, thanks for commenting. I should note that there’s a difference between “statistical entanglement” and “indirect statistical effect.” I limit the former term to situations where you have statistics on both sides, but it is largely (or entirely) impossible to tell from the data who is responsible for what. In this post I used an indirect statistical examination (in this case “With or Without You” stats, as ANFLStats calls them) to show that, for Randy Moss, there is an unusually large amount of evidence that suggests he has been the responsible party. By extension, this result suggests that WR’s can have a large impact on QB stats, which is one-half of the entanglement picture (that QB’s can affect their WR’s stats is uncontroversial).
With Revis, it sounds like you are talking about his effect on the defense overall. That is, in addition to whatever stats Revis puts up himself, we can indirectly measure his value by seeing how much worse the Jets defense does when he is out. There could be a potential entanglement issue if overall defensive quality has a significant effect on cornerback stats, but I don’t think that’s an issue here.
[…] to how drastically he has changed teams, and their quarterbacks, once he has joined a new team. The Randy Moss effect ion entanglement is chronicled brilliantly and extensively here, where the author on skepticalsports.com talks about […]
While I agree with most of the analysis, I question the inclusion of Brady and Cassel in the ‘before and after’ number crunching. Because of Brady’s injury he did not play in 2008 and did not appear to be 100% healthy in 2009 – plus, the rest of the team was drastically altered by that point. Cassel was a QB only because of that same injury and was on a completely different team the following year, so I don’t see how you can include him in the discussion.
When building a data-set, I try to be as fair and neutral as possible about what data to include or exclude. There is always a trade-off between broadness and representativeness. When there are various arguments that a particular data-point may or may not be representative, I try to err on the side of inclusion. While there may be no a priori reason why over-inclusion is any better than under-inclusion, I think the former brings less of a risk of intentionally or unintentionally biasing of the pool toward your desired results.
Ideally, it would be nice to have Randy Moss isolated as the only variable that changes in each comparison, but I have to work with what’s available. If I excluded every quarterback who changed teams or suffered a major injury, the list of data points would drop to zero. While this data may be less than ideal, it is clearly more probative than nothing.
For Brady, I don’t follow your logic. Yes, he missed 2008 due to injury, but the reason he missed that season is incidental, as it has no effect on his +/- numbers. In 2009 he may still not have been 100%, but he played with Moss and still posted numbers better than his career averages. However, Brady’s 2007 season was so strong that excluding 2009 would still improve Moss’s standing in this analysis. Thus, I think the more “cautious” choice is to include it — especially to be consistent with other QB’s whose injury-plagued seasons (both with and without Moss) are included as well. In fact, the Brady data-point is probably one of the most reliable in the set overall.
As for Cassell, you can definitely make the case that it’s unfair to compare his performance on a contending Patriots team to his performance on an awful Kansas City squad. So it would be correct to say that comparison shouldn’t itself prove anything. But if Cassell were just as good or better with KC than he was with Moss/NE, that would be a strong data point *against* the hypothesis, which means this point is clearly at least *relevant*, which is good enough for me.
[…] reliably factor the quality of coaching and management out of the process. And while the entanglement issue is a difficult one in the case of quarterbacks and wide receivers, it’s probably impossible […]
[…] Point Shares (GPS) is not WAR. It is not trying to be WAR. Hockey inherently has far more statistical entanglement to its structure than baseball, which is mostly predicated on one-on-one match-ups that produce […]
[…] player performance is notoriously more difficult to quantify in football than in baseball. On the gridiron, detailed individual […]
[…] and everything else. Even his broader statistical portfolio is largely a team accomplishment, and untangling everyone’s contributions can be nearly impossible. But one indicator of the strength of a […]
Thanks for showing to the world at-large something I’ve known for a long time: Randy Moss is the GREATEST field tilter in the history of the NFL.
That the Vikings went 9-7 before drafting Moss, and for the most part remained ceteris paribus the same team, before going 15-1 (3 points away from 16-0), with a Randall Cunningham that had been a year out of the league and a back-up the season prior, is an incredible accomplishment. That 15-1 Vikings team was the then-highest scoring teaming history mostly thanks to Moss and the almost unquantifiable effect he had on time of possession and the production of his teammates.
Ditto for the 16-0 Patriots team.
Moss is the GOAT. Brilliant article and well-constructed arguments.
[…] does not account for quarterback quality. I’ll get back to this in a later post though it is very difficult to separate out a quarterbacks’ influence on his receivers, so it is best to leave quarterback quality […]
[…] a playoff game, what tools do we use to define such a person? What tools would we use to eliminate entanglement, in this case between the team’s overall offensive strength and the QB […]