[For ease of reference—with apologies to those of you who sat through or otherwise already read my NFL Live Blog from this Sunday—I’m once again splitting a few of the topics I covered out into individual posts. I’ve made mostly made only cosmetic adjustments (additional comments are in brackets or at the end), so apologies if these posts aren’t quite as clean or detailed as a regular article. For flavor and context, I still recommend reading the whole thing.]
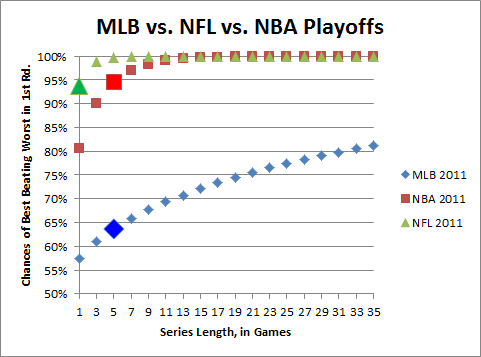
In support of last night’s screed [Why Baseball and I are, Like, Unmixy Things], especially the claim that “[MLB] games are either not important enough to be interesting (98% of the regular season), or too important to be meaningful (100% of the playoffs),” here’s a graph I made to illustrate just how silly the MLB Playoffs are:
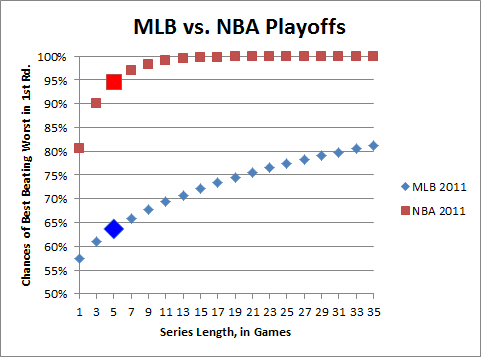
Not counting home-field advantage (which is weakest in baseball anyway), this represents the approximate binomial probability [thank you, again, binom.dist() function] of the team with the best record in the league [technically, a team that has an actual expectation against an average opponent equal to best record] winning a series of length X against the playoff team with the worst record [again, technically, a team that has an actual expectation equal to worst record] going in. The chances of winning each game are approximated by taking .5 + better win percentage – worse win percentage (note, of course, the NFL curve is exaggerated b/c of regression to the mean: a team that goes 14-2 doesn’t won’t actually win 88% of their games against an average opponent. But they won’t regress nearly enough for their expectation to drop anywhere near MLB levels). The brighter and bigger data points represent the actual first round series lengths in each sport.
By this approximation, the best team against the worst team in a 1st round series (using the latest season’s standings as the benchmark) in MLB would win about 64% of the time, while in the NBA they would win ~95% of the time. To win 2/3 of the time, MLB would need to switch to a 9 game series instead of 5; and to have the best team win 75% of the time, they would need to shift to 21 (for the record, in order to match the NBA’s 95% mark, they would have to move to a 123 game series. I know, this isn’t perfectly calculated, but it’s ballpark accurate). Personally, I like the fact that the NBA and NFL postseasons generally feature the best teams winning.
Moreover, it also makes upsets more meaningful: since the math is against “true” upsets happening often, an apparent upset can be significant: it often indicates—Bayes-wise (ok, if that’s not a word, it should be)—that the upsetting team was actually better. In baseball, an upset pretty much just means that the coin came up tails.
Adam asks:
In the MLB vs. NFL vs. NBA Playoffs graph, the chances of best beating worst in first round for NFL for a 1 game series is almost 95%.
Looking at the odds to this week’s NFL games, the biggest favorite was GB verses Denver and they were only an 88% chance of winning by the money line (-700). Denver is almost certainly not a playoff team, so it’s tough to imagine an even more lopsided playoff matchup that could get to 95%. What am I missing?
I sort of addressed this in my longer explanation, but he’s not missing anything: the football effect is exaggerated. First off, to your specific concern, this early in the season there is even more uncertainty than in the playoffs. But second, and more importantly, this method for approximating a win percentage is less accurate in the extremes, especially when factoring in regression to the mean (which is a huge factor given the NFL’s very small sample sizes).
In fact, the regression to the mean effect in the NFL is SO strong, that I think it helps explain why so many Bye-teams lose against the Wild Card game winners (without having to resort to “momentum” or psychological factors for our explanation). By virtue of having the best records in the league, they are the most likely teams to have significant regression effects. That is, their true strength is likely to be lower than what their records indicate. Conversely, the teams that win in the bye week (against other playoff-level competition), are, from a Bayesian perspective, more likely to be better than their records indicated. Think of it like this: there’s a range of possible true strength for each playoff team: when you match two of those teams against each other (in the WC round), the one who wins might have just gotten lucky, but that particular result is more likely to occur when the winning team’s actual strength was closer to the top of their range and/or their opponent’s was closer to their bottom.
I’ve looked at this before, and it’s very easy to construct scenarios where WC teams with worse records have a higher projected strength than Bye team opponents with better records. Factor in the fact that home field advantage actually decreases in the playoffs (it’s a common misconception that HFA is more important in the post-season: adjusting for team quality, it’s actually significantly reduced—which probably has something to do with the post-season ref shuffle: see section on ref bias in this post), and you have a recipe for frequent upsets.
In retrospect, I probably should have just left the NFL out of that graph. Basketball makes for a much better comparison [both aesthetically and analytically]:

