[Preface: With apologies to people those of you who sat through or otherwise already read my NFL Live Blog from Sunday, it is incredibly long, so I thought maybe I should split out individual posts for some of the individual topics I covered. I’ve removed the time-stamps and re-organized a bit, but this is all original, so it obviously may not be as clean or detailed as a regular article (any additional comments I’ll put in brackets or at the end). If this sort of stuff interests you, I will be live-blogging again this Sunday.]
This may not be the most controversial statement, but I think the two most powerful forces in the NFL over the last decade have been Peyton Manning and Bill Belichick (check out the 2nd tab as well):
[Main axes are] wins in season n against wins in season n+1. [Note (May 28, 2012): Updated through 2011 season.]
In case you haven’t seen it, the old “Graph of the Day” that I tweaked for the above is here.
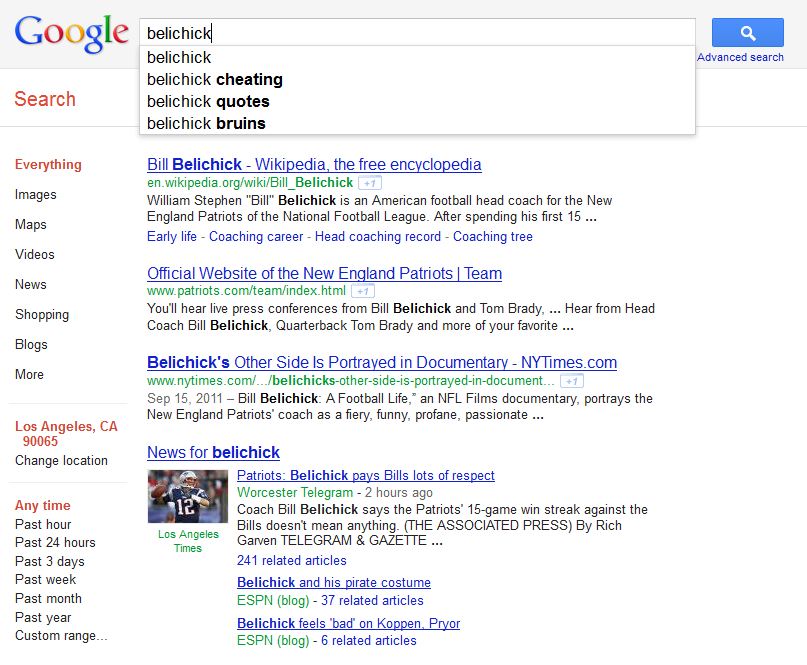
Belichick, of course, is known for winning Super Bowls, going for it on 4th down, and:
Good thing he doesn’t have to worry about potential employers Googling him.
Since I [was] watching the Indy game, a few things about Peyton Manning:
First, a quick over/under: .5, for number of Super Bowls won by Peyton Manning as a coach? I mean, I’d take the under obv just b/c of the sheer difficulty of winning Super Bowls, but I’d be curious about the moneyline.
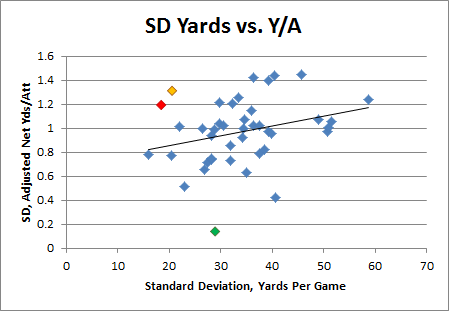
[Here’s] something completely new to me. Not sure exactly what to make of it, but it’s interesting:
This is QB’s with 7+ seasons of 8+ games who averaged 200+ yards per game (n=42). These are their standard deviations, from season to season (counting only the 8+ gm years), for Yards per Game vs. Adjusted Net Yards Per Attempt.
The red dot is our absentee superstar, Peyton Manning, and the green is Johnny Unitas. The orange is Randall Cunningham, but his numbers I think are skewed a bit because of the Randy Moss effect. The dot at the far left of the trend-line is Jim Kelly.
So what to make of it? I’ve been mildy critical of Adjusted Net Yards Per Attempt for the same reasons I’ve been critical of Win Percentage Added: Since the QB is involved in basically every offensive play, both of these tend to track two things:
- Their raw offensive quality, plus (or multiplied by)
- The amount which the team relies on the passing game.
Neither is particularly indicative of a QB doing the best with what he can, as it is literally impossible to put up good numbers in these stats on a bad team.
So it’s interesting to me that Peyton — who most would agree is one of the most consistent QB’s in football — would have such a high ANY/A standard dev (he also has a larger sample than some of the other qualifiers).
An incredibly superficial interpretation might be that Peyton sacrifices efficiency in order to “get his yards.” OTOH, this may be counter-intuitive, but I wonder if it’s not actually the opposite: Peyton was an extremely consistent winner. Is it possible that the ANY/A to some extent reflected the quality of his supporting cast, but the yards sort of indirectly reflect his ability to transfer whatever he had into actual production? Obv I’d have to think about it more.
With their schedule, Indy may be eliminated from playoff contention before Manning even starts thinking about a return. Could be good for them next year, though: San Antonio Gambit, anyone?
Okay, one last thought: In this post, Brian Burke estimates Manning’s worth to that team, and uses the team’s total offensive WPA as a sort of “ceiling” for how valuable Manning could be:
In this case, it can tell us how many wins the Peyton Manning passing game can account for. Although we can’t really separate Manning from his blockers and receivers, we can nail down a hard number for the Colts passing game as a whole, of which Manning has been the central fixture.
The analysis, while perfectly good, does ignore two possibilities: First, the Indianapolis offense minus Manning may be below average (negative WPA), in which case the “Colts passing game” as a whole would understate Manning’s value: E.g., he could be taking it from -1 to +2.5, such that he’s actually worth 3.5, etc. Second, even if you could get a proper measure of how much the offense would suffer without Manning, that still may not account for the degree to which the Indianapolis offense bolstered their defense’s stats. When you’re ahead a lot, you force the other team to make sub-optimal plays that increase variance to give themselves some opportunity to catch up: this makes your defense look good. In such a scenario, I would imagine hearing things like, “Oh, the Indianapolis defense is so opportunistic!” Hmmm.

