9/25 NFL Sunday Live Blog

As promised, I’ll be live-blogging all day.  Details here.

I’ll finally be getting NFL Sunday Ticket later this week (DirecTV is cheaper than cable, who knew?), but for now I’m stuck with what the networks give me.  As of last night, I thought the early game was going to be New England against Buffalo, but now my channel guide is saying Philadelphia/Giants.  I’ll find out in a few minutes.

This may not be the most controversial statement, but I think the two most powerful forces in the NFL over the last decade have been Peyton Manning and Bill Belichick (check out the 2nd tab as well):

I’m sure I’ll have more to say about the Great Hoodied One over the course of the day, so, for now, on with the show:

9:55 am: Watching pre-game.  Strahan is taking “overreaction” to a new level, not only declaring that maybe the NFL isn’t even ready for Cam Newton, but that this has taught him to stop being critical of rookie QB’s in the future.

10:00 am: CBS pregame show over and now it’s a paid advertisement for the Genie Bra (I’m so tempted).  And, yep, Fox has the Philly game.

10:10: In case you haven’t seen it, the old “Graph of the Day” that I tweaked for the above is here.

10:15: Nothing wrong with that interception by Vick.  Ugh, commercials.  I hate Live TV, especially when there’s only one thing on.

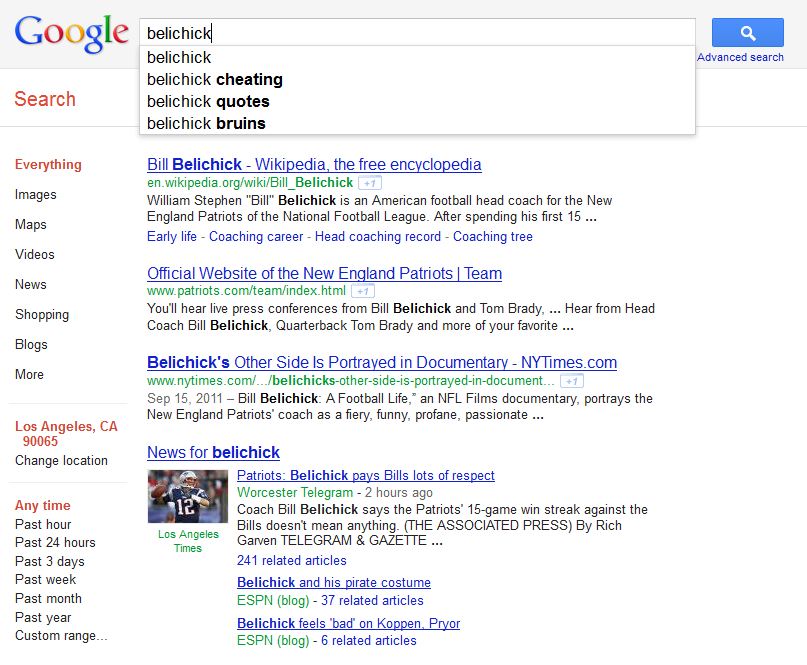
10:20: Belichick, of course, is known for winning Super Bowls, going for it on 4th down, and:

Good thing he doesn’t have to worry about potential employers Googling him.

10:24: Manning gets first blood in this battle of “#1 draft picks who everyone was ready to give up on but then performed miracles.”

10:30: True story: Yesterday, my wife needed a T-shirt, and ended up borrowing my souvenir shirt from SSAC (MIT/Sloan Sports Analytics Conference). She was still wearing it when we went to see Moneyball last night, and, sure enough, she ended up liking it (nerd!) and I thought it was pretty dull.

10:35: David: Wins in season n against wins in season n+1.  Sorry, maybe should have explained that.

10:39: Aaron Schatz tweeted:

FO_ASchatz

Bills go for it on fourth-and-14 from NE 35… and Fitzpatrick throws his second pick (first that is his fault)

4th and 14 is a situation where I think more quarterbacks throw too few interceptions than throw too many.

10:48: Tom Coughlin thinks LeSean McCoy is the fastest running back in the NFL? Which would make him faster than Chris Johnson? Who thinks he’s faster than Usain Bolt?  What is he, a neutrino?

11:00: O.K., per Matt’s request, I’ve added a “latest updates” section to the top.  Let me know if you like this better.

11:05: And sorry about the neutrino joke.  Incidentally, it probably goes without saying, but CJ is not as fast as Bolt in the 40. Bolt is the fastest man on earth at any distance from 50 meters to 300.  I’ll post graphs in a bit.

11:17: Man, I am having all kinds of browser problems.  May have to switch computers.  Anyway, here’s a Bolt graph:

Since we know his split time (minus reaction) over 32.8 yards was 3.64 seconds, using the curve above we can nail down his time at 40 yards pretty accurately: it’s around 4.19 to 4.21. (Note, the first 50 Meters of Bolt’s 100M world record were faster than the record for 50 meters indoors.)

11:25: Incidentally, Chris Johnson’s 40 time of 4.25 is bogus.  I won’t go into all the details, but I’ve calculated his likely 40 time (for purposes of comparison with Bolt), and it’s more like 4.5.  Of course, that’s a bit of “apples to oranges” while combine times vs. each other are “apples to apples,” but the point is that Bolt’s advantage over CJ is much bigger than .05.

11:28: Ok, halftime.  Unremarkable game so far, though Eli got a good stat boost from a couple of nice catch-and-runs.  I would love to see how Vick performs under pressure, so I’m glad they’ve gotten close again.  Going to grab a snack.

11:44: Matt: I’ve seen a few things, but I don’t have the links in front of me. Prior to Berlin, Usain was definitely known as a slow starter with a crazy top speed that made up for it, but in his 9.58 WR run he was pretty much textbook and led wire to wire, posting the fastest splits ever at every point.

11:58: Lol, everyone loves when linemen advance the ball.  Until they fumble.  Then they’re pariahs.

12:07: I haven’t really used Advanced NFL Stats WPA Calculator much, as I’ve been (very slowly) trying to build my own model.  But I just noticed it doesn’t take time outs into account.  I’m curious whether that’s the same for his internal model or if that’s just the calculator.  Obv timeouts make a huge difference in endgame or even end-half scenarios (and accounting for them properly is one of the toughest things to figure out).

12:11: Man, I was just thinking how old I must be that I remember the Simpson’s origins on the Tracy Ullman show, but the Fox promo department made me feel all better by viscerally reminding me that they’re still on.

12:14: Google Search Leading to My Blog of the Day: “what sport does dennis rodman play”

12:22: So Both Donovan McNabb and Michael Vick have been considerably better QB’s in Philadelphia than elsewhere.  At some point, does Andy Reid get some credit?  Without a Super Bowl ring, he’s generally respected but not revered in the mainstream, and he’s such a poor tactician that he’s dismissed by most analytics types.  But he may be one of the best offensive schemers in the modern era.

12:34: Moneyball nit-picking: The Athletics won their last game of the season in 2004, 2005, 2007, and 2010. (It’s not that hard when you don’t make the playoffs).

12:40: I kind of feel the same way about Vick that I felt about Stephen Strasbourg after he hurt his arm last year: their physical skills are so unprecedented that, unfortunately, Bayesian inference suggests that their injury-proneness isn’t a coincidence.

12:45: David: I just mean that he has notoriously bad time management skills, makes ridiculous 4th down decisions, and generally seems clueless about win maximization, esp. in end-game scenarios.

12:48: So if the Eagles go on to lose, does this make Vick 1-0 with 2 “no decisions” for the year?

12:54: Wow, Tom Brady has as many. . . Crap, Aaron Schatz beat me to it:

FO_ASchatz

Tom Brady has as many INT in this game as he had all last year. Egads.

12:57: Dangit, exciting New England end-game and I’m stuck watching the Giants beat Vick’s backup.  Argh!

1:03: Really Moneyball is all about money, not statistics. Belichick would be such a better subject for a sports-analytics movie than Billy Beane.  It’s dramatic how Belichick has been willing to do whatever it takes to win—whether it be breaking the rules or breaking with convention—plus, you know, with more success.

1:06: “Bonus Coverage” on Fox is Detroit v. Minnesota.  CBS just started KC/San Diego.

1:14: Top-notch analysis from Arturo:

ArturoGalletti

Holy effin Christ. Bills/Pats
4 minutes ago

1:19: Nate: Are you referring the the uber-exciting Pats/Bills game that I can’t watch?  I’ll check the p-b-p.

1:27: Congrats Nate and Lions fans everywhere!

1:30: Ok, I’m going to take a short lunch break, I’ll be back @ 2ish PST.

2:05: Nate asks:

Any thoughts on the Lions kicking a 32-yard FG in overtime from the left hash on first down?

I’ve thought about this situation a bit, and I don’t hate it.  Let me pull up this old graph:

So a kneel in the center is maybe slightly better: generically, they lose a percentage or two, but I’m pretty sure that even from that distance you lose a percentage or two for being on the hash.  Kickers are good enough at that length that going for extra yards or a TD isn’t really worth it, plus you’re not DOA even if you miss (while you might be if you turn the ball over).

2:08: Btw, I’ve got Green Bay/Chicago of Fox to go with aforementioned KC/SD on CBS.

2:12: Also from that post where the graph came from, the “OT Choke Factor” for kicks of that length is negligible.

2:35: So this Neutrino [measured as faster-than-light, in case you’ve been living under a rock or aren’t a total dork] situation is pretty fascinating to me.  What’s amazing is that, even days later, no one has been able to posit a good theory for either the result-as-good OR where the error might be coming from.

Note this wasn’t like some random crackpot scientist, this was a massive team at CERN, which is like the Supreme Court of the particle physics world.

It’s a bit like if you brought the world’s best mathematicians and computer scientists together to design a simple and effective way to calculate Pi, only to have it spit out 3.15.  It just can’t possibly be, yet no one has a good explanation for how they screwed up.

To complicate things further, you have previous, “statistically insignificant” results at MINOS that also clocked neutrinos as FTL.  Indepedently, this should be irrelevant, but as a Bayesian matter, a prior consistent result — even an “insignificant” one — can exponentially increase the likelihood of the latter being valid.  If it had been any other discovery, this would be iron-clad evidence, and it would probably be scientific “consensus” by now.

So, as a second-order observation, assuming they eventually do find whatever the error may be in this case, doesn’t it suggest that there may be other “consensus” issues with similarly difficult-to-find errors underlying them that were simply never challenged b/c they weren’t claiming that 2+2=5?

2:36: Ok, I think I’m required by Nerd Law to post the XKCD comic on the topic:

2:41: Added links.

2:43: Argh.  NFL Live Blog, I know.  Sorry.

2:52: News says that a 3.3 earthquake “hit” Los Angeles today.  Um, 3.3.  I’m pretty sure that’s also known as “not an earthquake.”

3:05: OK, this has little to do with the game I’m “watching” (something about the non-Detroit NFC central bores me now with Favre gone and Lovie/Martz coaching in Chicago), but here’s a brand new (10 minutes old) bar chart from my salary study:

Obv this stuff becomes more meaningful in a regression context, but it’s interesting even at this level.  A little interpretation to follow.

3:20: “Overspending” is the total amount spent above the sum of cap values for all your active players, like “loading up” on one year by paying a lot of pro-rated signing bonuses.  For position players, their cap value is the best (salary-based) predictor of their value, so, unsurprisingly, teams with high immediate cap values tend to have the better teams (while total money spent also correlates positively, it’s entirely because it also correlates with total cap value).

What’s interesting about running backs is that RB cap value correlates positively, but signing bonus correlates negatively.  My unconsidered interpretation is that RB’s are valuable enough to spend money on when they’re actually good, but they’re too hard to evaluate to try to buy yourself one.

3:36: Matt Glassman asks:

Question re: field goals — What percentage are you looking for your kicker to have at the longest range you are willing to regularly (i.e. throughout the game) use him?

I’ll use a static example: if your kicker was a known 50% from 52 yards, would you regularly take that over a punt? What about 40%, etc. Then make it dynamic, where the kicker has some shrinking probability as he moves back, and the coach has a decision about whether to kick/punt from a given distance. At what maximum distance/percentage do you regularly kick, rather than regularly punt.

This is a good question and topic, but it’s extremely hard to generalize. It depends on your game situation and what your alternatives are. Long kicks, for example, are generally bad—even with a relatively good long-range kicker.  But in late-game or late-half scenarios, clearly being able to take long kicks can be very valuable.

It is demonstrable, however, that NFL kickers have gotten incredibly good compared to past kickers.  Aside from end-game scenarios, kicking FG’s used to be almost universally dominated by going for it (or sometimes punting). But since kickers have become so accurate, the balance has gotten more delicate.

Also [sort of contra Brian Burke, I’m thinking of a link but can’t find it], I think individual team considerations are a much bigger factor in these decisions than just raw WPA.  It depends a lot on how good your offense is, how good it is at converting particular distances, how good your defense is, etc.  While the percentage differences may be fairly small for the instant decision, they pile up on each other in these types of multi-pronged calculations.

3:50: I have to admit, Aaron Rodgers is a great QB who seems to defy my “Show me a QB who doesn’t throw interceptions, and I’ll show you a sucky quarterback” rule of thumb.  And it’s not like Tom Brady, who throws INT’s when his team is struggling and doesn’t throw them when his team is awesome (which, ofc, I have NO problem with): Rodgers has a crazy-low INT rate on a team that has been mediocre (2008), good-but-not-great (2009), or all over the place (2010) during his 3 years as a starter.

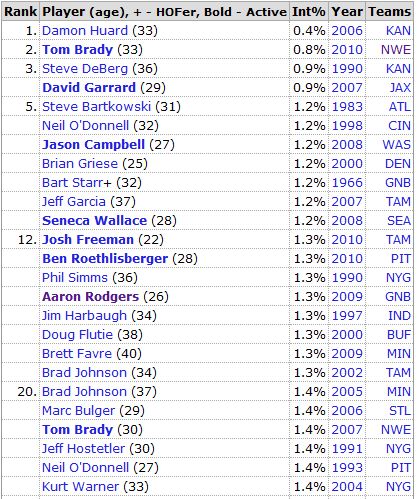
4:05: Ok, purely for fun, let’s compare the all-time single-season leaders in (low) Int% (from Pro Football Reference):

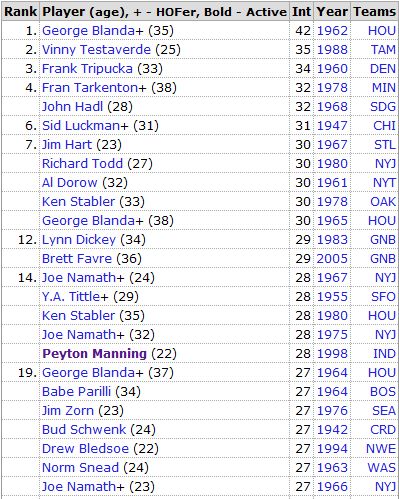
With the all-time leaders for most INT thrown (also from Pro Football Reference):

Not drawing any conclusions or doing any scientific comparisons, but both lists seem to have plenty of studs as well as plenty of duds. (Actually, when I first made this comparison a couple of years ago, the “Most” list had a much better resume than the “Least” list.  But since then, the ‘good’ list has added several quality new members.)

4:11: O.K., I think I’m switching to Football Night in America.  Peter King! He was the first sports columnist I ever read regularly (though eventually I stopped).  I mean, he talks and writes completely out of his ass, but there’s a kind of refreshing sincerity about him.

4:24: So should I be more or less excited about Cam Newton after his win today?  He had a much more “rookie-like” box of 18/34 for 158.  Here’s how to break that down for rookies: Low yards = bad. High attempts = good.  Completion percentage = completely irrelevant. Win = Highly predictive of length of career, not particularly predictive of quality (likely b/c a winning rookie season gets you a lot of mileage whether you’re actually good or not). Oh, and he’s still tall:  Height is also a significant indicator (all else being equal).

Short break, back in a few.

4:43: Detroit is currently 3-0 and leading the league in Point Differential at +55, and unlikely to be passed by anyone any time soon [by which I mean, this weekend].

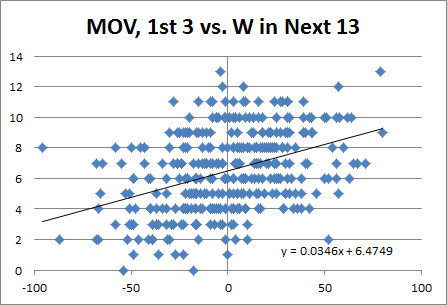
4:58: That +55 would be the 16th best since 2000.  Combined with their 3-0 record, they project to win ~11 games, though with lots of variance:

Yes, this can be calculated more precisely, but it will be around 11 games regardless.

5:12: The teams who led in MOV after 3 weeks since 2000 were:

  • 2010: Pittsburgh, +39, Lost Super Bowl
  • 2009: New Orleans, +64, Won Super Bowl
  • 2008: Tennessee, +43, Lost Divisional
  • 2007: New England, +79, Lost Super Bowl
  • 2006: San Diego, +57, Lost Divisional
  • 2005: Cincinatti, +60, Lost Wild Card
  • 2004: Seattle, +52, Lost Wild Card
  • 2003: Denver, +65, Lost Wild Card
  • 2002: Miami, +63, Missed Playoffs
  • 2001: Green Bay, +80, Lost Divisional
  • 2000: Tampa Bay, +67, Lost Wild Card

Not bad.  Only Miami missed the playoffs, and they were in a 3 way tie atop AFC East at 9-7.

5:23: I hate to keep going back to Schatz, but he posts so much and so fast that he’s dominating my Twitter feed.  Anyway, the latest:

Weird week for FO Premium picks. 8-6 vs. spread (4-0 Green/Yellow) but 5-9 straight up.

In 2002, I picked better against the spread than straight up over the entire season (picking every game).

5:34: Shout-out to Matt Glassman for plugging my live blog on his:

One look at his blog will convince you that he’s not only a killer sports statistician, but he’s also an engaging and humorous writer.

Though, at best, this generous praise is a game of “Two Truths and a Lie.”  [I’m not even remotely a statistician.]

5:39: If I were more clever, I’d think of some riff off the Jay-Z’s 99 problems line:

Nah, I ain’t pass the bar but i know a little bit

Enough that you won’t illegally search my shit

Incidentally, love the Rap Genius annotation for that lyric (also apt to my situation):

If you represent yourself (pro se), Bar admission is not required, actually

5:55: Since I’m obv watching the Indy game, a few things Peyton Manning coming up.  First, a quick over/under: .5, for number of Super Bowls won by Peyton Manning as a coach?

I mean, I’d take the under obv just b/c of the sheer difficulty of winning Super Bowls, but I’d be curious about the moneyline.

6:20: Sorry, was looking at something completely new to me.  Not sure exactly what to make of it, but it’s interesting:

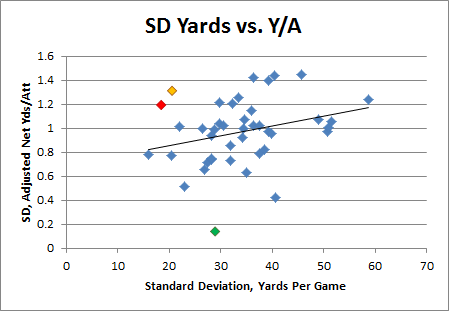
This is QB’s with 7+ seasons of 8+ games who averaged 200+ yards per game (n=42).  These are their standard deviations, from season to season (counting only the 8+ gm years), for Yards per Game vs. Adjusted Net Yards Per Attempt.

The red dot is our absentee superstar, Peyton Manning, and the green is Johnny Unitas.  The orange is Randall Cunningham, but his numbers I think are skewed a bit because of the Randy Moss effect.  The dot at the far left of the trend-line is Jim Kelly.

6:28: So what to make of it?  I’ve been mildy critical of Adjusted Net Yards Per Attempt for the same reasons I’ve been critical of Win Percentage Added: Since the QB is involved in basically every offensive play, both of these tend to track two things: 1) Their raw offensive quality, plus (or multiplied by) 2) The amount which the team relies on the passing game.  Neither is particularly indicative of a QB doing the best with what he can, as it is literally impossible to put up good numbers in these stats on a bad team.

So it’s interesting to me that Peyton — who most would agree is one of the most consistent QB’s in football — would have such a high ANY/A standard dev (he also has a larger sample than some of the other qualifiers).

6:35: An incredibly superficial interpretation might be that Peyton sacrifices efficiency in order to “get his yards.” OTOH, this may be counter-intuitive, but I wonder if it’s not actually the opposite: Peyton was an extremely consistent winner.  Is it possible that the ANY/A to some extent reflected the quality of his supporting cast, but the yards sort of indirectly reflect his ability to transfer whatever he had into actual production? Obv I’d have to think about it more.

6:42: I think when this is over, maybe I should split it into separate parts, roughly grouped by content?  Getting unwieldy, but kind of too late to split it now.

7:02: So, according to the commentators, Mike Wallace is now the fastest player in the NFL, which makes him faster than LeSean McCoy, who (as the fastest RB) is faster than Chris Johnson, who (by proclamation) is faster than Usain Bolt, who is the fastest man on the planet.  So either someone is an alien (or a neutrino! [sorry, can’t help myself]), or something’s got to give.

7:17: David asks:

Q: The Bills for real? What do they project to over a season?

Um, I don’t know.  Generically, being 3-0 and +40 projects to 10 or 11 wins, but there’s a lot of variance in there.  The previous season’s results are still fairly significant, as are the million other things most fans could tick off.  Another statistically significant factor that most people prob wouldn’t think of is preseason results.  The Bills scored 24 and 35 points in games 2 and 3 of the preseason.  There’s a ton of work behind this result, but basically I’ve found that points scored plus points scored in games 2 and 3 of the preseason (counting backwards) is approximately as predictive as points scored minus points allowed in one game from the regular season.  So, loosely speaking, in this case, you might say that the Bills are more like a 4-0 team, with the extra game worth of data being the equivalent of a fairly quality win over a Denver/Jacksonville Hybrid.

7:27: I’d also note that it’s difficult to take strength of schedule into account at this point, at least in a quantitative way.  You can make projections about the quality of a team’s opponents, but the error in those projections are so large at this point that they add more variance to your target team’s projections than they are worth.  Or, maybe a simpler way to put it: it’s hard enough to adjust for quality of opponent when you *know* how good they were, and we don’t even know, we just have educated guesses.  (Even at the END of the season, I think a lot of ranking models and such don’t sufficiently account for the variance in SoS: that is, when a team beats x number of teams with good records, they can do very well in those rankings, even though some of the teams they beat overperfomed in their other games.  In fact, given regression to the mean, this will almost always be the case.  Of course, a clever enough model should account for this uncertainty.)

7:28: Man, that was a seriously ramble-y answer to a simple question.

7:44: I remember Mike Wallace being a valuable backup on my fantasy team in 2009, otherwise, meh.  Seems to talk a lot of crap that these announcers eat up.  Ironically, though, if a rookie or a complete unknown starts a season super-hot, commentary is usually that they’re already the next big thing, while a quality-but-not-superstar veteran with a hot start is often just credited with a hot start.  But, in reality, I think the vet, despite being more of a known quantity, is still more likely to take off.  In this case, they’re busting out the hyperbole regardless.

8:03: Speaking of which, does anyone remember Ryan Moats?  A stringer for Houston in 2009, he ended up starting (briefly) after a rash of injuries to his teammates. In his first start (against Buffalo), he had 150 yards and 3 touchdowns, and some fantasy contestants were falling over each other to pick him up.  After that, he had 2 touchdowns the rest of the season, and then was out of football.

8:07: Polamalu to the rescue, of course.  He’s so good that I think he improves the Steeler’s offense.  (And no, not kidding.)

8:13: So, with Sunday Ticket’s streaming content, instead of watching Monday Night Football, I could watch several whole games instead.

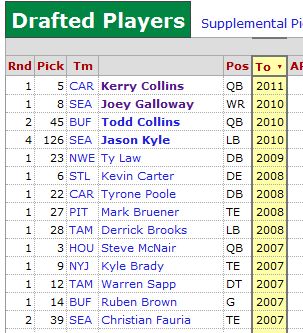
8:20: So I always think of Kerry Collins as a pretty bad QB, but damn: he’s the last man standing from the entire 1995 draft:

And, you know, he’s not dead.  So I guess he won that rivalry.

8:25: Oooh, depending on the time out situation, that might have been a spot where dropping just short of the first down would have been better than making it.  Too bad Burke’s WPA Calculator doesn’t factor in time outs!

8:31: So before this is over, one more fun fact about Usain Bolt: In his 100M record run, he maintained a minimum speed over a 40 meter stretch that no other man has ever achieved over 10.

8:32: CC just said kickers prefer being on the left hash. [Though the justification was kind of weak.]

8:35: Congrats Steelers, and condolences to Colts fans.  With their schedule, Indy may be eliminated from playoff contention before Manning even starts thinking about a return.  Could be good for them next year, though:  San Antonio Gambit, anyone?

8:38: No Post Game Show for me.  Peace out, y’all.

8:59: Okay, one last thought:  In this post, Brian Burke estimates Manning’s worth to that team, and uses the team’s total offensive WPA as a sort of “ceiling” for how valuable Manning could be:

In this case, it can tell us how many wins the Peyton Manning passing game can account for. Although we can’t really separate Manning from his blockers and receivers, we can nail down a hard number for the Colts passing game as a whole, of which Manning has been the central fixture.

The analysis, while perfectly good, does ignore two possibilities: First, the Indianapolis offense minus Manning may be below average (negative WPA), in which case the “Colts passing game” as a whole would understate Manning’s value: E.g., he could be taking it from -1 to +2.5, such that he’s actually worth 3.5, etc.  Second, even if you could get a proper measure of how much the offense would suffer without Manning, that still may not account for the degree to which the Indianapolis offense bolstered their defense’s stats.  When you’re ahead a lot, you force the other team to make sub-optimal plays that increase variance to give themselves some opportunity to catch up: this makes your defense look good. In such a scenario, I would imagine hearing things like, “Oh, the Indianapolis defense is so opportunistic!” Hmmm.
New! This Sunday: Wire-to-Wire NFL Live-Blog

With a nice vacation under my belt and the NFL season underway, I figure it’s a good time to shift some of my attention back to the blog.  I’m working on finishing and writing up some of the research and analysis I’ve been doing for a number of different sports and contexts (even baseball), so I should have some pretty interesting and diverse things to post about in the coming weeks.  But I’d also like to try some new things content-wise, and one of those that I’m very excited about is doing a regular NFL live-blog:  So, for the first time this Sunday, I’ll be conducting an all-day live blog—starting from the first kick-off and continuing all the way through the night game.

Obv I’ll be kind of making up the format as I go along, but I expect it to be a little different from your usual play-by-play with instant reactions.  We’ll see what works and what doesn’t, but my intention is for it to be a bit more of a window into how I watch the NFL, and the kinds of things I think about and explore in the process, like:

  • Random thoughts and observations related to the games and coverage that I’m watching.
  • Quick and dirty analysis (I’ve got my databases locked and loaded, and there will be graphs).
  • Relevant tidbits from or previews of some of my ongoing research.
  • Links and/or brief discussions of relevant articles, tweets, blog posts or other things that I’m reading.
  • Other random ideas (sports related or not) that grab me and won’t let go.

Additionally, if there are any reader questions, criticisms, or comments that come up, I’ll be monitoring and responding to them throughout the day (and these don’t necessarily have to be on topic: so if you have the urge to pick my brain, challenge my ideas, or point out any of my stupid mistakes, this will be a good opportunity to get an immediate response).

I’ll be starting just before the first kickoff, around 10am PST.  So, you know, be there, drop on by, I’ll make it worth your while, see you then, etc.

Graph of the Day: Alanis Loves Rookie Quarterbacks

Last season I did some analysis of rookie starting quarterbacks and which of their stats are most predictive of future NFL success. One of the most fun and interesting results I found is that rookie interception % is a statistically significant positive indicator—that is, all else being equal, QB’s who throw more interceptions as rookies tend to have more successful careers.  I’ve been going back over this work recently with an eye towards posting something on the blog (coming soon!), and while playing around with examples I stumbled into this:

Note: Data points are QB’s in the Super Bowl era who were drafted #1 overall and started at least half of their team’s games as rookies (excluding Matthew Stafford and Sam Bradford for lack of ripeness). Peyton Manning and Jim Plunkett each threw 4.9% interceptions and won one Super Bowl, so I slightly adjusted their numbers to make them both visible, though the R-squared value of .7287 is accurate to the original (a linear trend actually performs slightly better—with an R-squared of .7411—but I prefer the logarithmic one aesthetically).

Notice the relationship is almost perfectly ironic: Excluding Steve Bartowski (5.9%), no QB with a lower interception percentage has won more Super Bowls than any QB with a higher one. Overall (including Steve B.), the seven QB’s with the highest rates have 12 Super Bowl rings, or an average of 1.7 per (and obv the remaining six have none).  And it’s not just Super Bowls: those seven also have 36 career Pro Bowl selections between them (average of 5.1), to just seven for the remainder (average of 1.2).

As for significance, obviously the sample is tiny, but it’s large enough that it would be an astounding statistical artifact if there were actually nothing behind it (though I should note that the symmetricality of the result would be remarkable even with an adequate explanation for its “ironic” nature).  I have some broader ideas about the underlying dynamics and implications at play, but I’ll wait to examine those in a more robust context. Besides, rank speculation is fun, so here are a few possible factors that spring to mind:

  1. Potential for selection effect: Most rookie QB’s who throw a lot of interceptions get benched.  Teams may be more likely to let their QB continue playing when they have more confidence in his abilities—and presumably such confidence correlates (at least to some degree) with actually having greater abilities.
  2. The San Antonio gambit: Famously, David Robinson missed most of the ’96-97 NBA season with back and foot injuries, allowing the Spurs to bomb their way into getting Tim Duncan, sending the most coveted draft pick in many years to a team that, when healthy, was already somewhat of a contender (also preventing a drool-worthy Iverson/Duncan duo in Philadelphia).  Similarly, if a quality QB prospect bombs out in his rookie campaign—for whatever reason, including just “running bad”—his team may get all of the structural and competitive advantages of a true bottom-feeder (such as higher draft position), despite actually having 1/3 of a quality team (i.e., a good quarterback) in place.
  3. Gunslingers are just better:  This is my favorite possible explanation, natch.  There are a lot of variations, but the most basic idea goes like this: While ultimately a good QB on a good team will end up having lower interception rates, interceptions are not necessarily bad.  Much like going for it on 4th down, often the best win-maximizing choice that a QB can make is to “gamble”—that is, to risking turning the ball over when the reward is appropriate. This can be play-dependent (like deep passes with high upsides and low downsides), or situation-dependent (like when you’re way behind and need to give yourself the chance to get lucky to have a chance to win).  E.g.: In defense of Brett Favre—who, in crunch time, could basically be counted on to deliver you either a win or multiple “ugly” INT’s—I’ve quipped: If a QB loses a game without throwing 4 interceptions, he probably isn’t trying hard enough.  And, of course, this latter scenario should come up a lot for the crappy teams that just drafted #1 overall:  I.e., when your rookie QB is going 4-12 and isn’t throwing 20 interceptions, he’s probably doing something wrong.

[Edit (9/24/2011) to add: Considering David Meyer’s comment below, I thought I should make clear that, while my interests and tastes lie with #3 above, I don’t mean to suggest that I endorse it as the most likely or most significant factor contributing to this particular phenomenon (or even the broader one regarding predictivity of rookie INT%).  While I do find it meaningful and relevant that this result is consistent with and supportive of some of my wilder thoughts about interceptions, risk-taking, and quarterbacking, overall I think that macroscopic factors are more likely to be the driving force in this instance.]

For the record, here are the 13 QB’s and their relevant stats:

[table “7” not found /]

MIT Sloan Sports Analytics Conference, Day 1: Recap and Thoughts

This was my first time attending this conference, and Day 1 was an amazing experience.  At this point last year, I literally didn’t know that there was a term (“sports analytics”) for the stuff I liked to do in my spare time.  Now I learn that there is not only an entire industry built up around the practice, but a whole army of nerds in its society.  Naturally, I have tons of criticisms of various things that I saw and heard—that’s what I do—but I loved it, even the parts I hated.

Here are the panels and presentations that I attended, along with some of my thoughts:

Birth to Stardom: Developing the Modern Athlete in 10,000 Hours?

Featuring Malcolm Gladwell (Author of Outliers), Jeff Van Gundy (ESPN), and others I didn’t recognize.

In this talk, Gladwell rehashed his absurdly popular maxim about how it takes 10,000 hours to master anything, and then made a bunch of absurd claims about talent. (Players with talent are at a disadvantage!  Nobody wants to hire Supreme Court clerks!  Etc.) The most re-tweeted item to come out of Day 1 by far was his highly speculative assertion that “a lot of what we call talent is the desire to practice.”

While this makes for a great motivational poster, IMO his argument in this area is tautological at best, and highly deceptive at worst.  Some people have the gift of extreme talent, and some people have the gift of incredible work ethic. The streets of the earth are littered with the corpses of people who had one and not the other.  Unsurprisingly, the most successful people tend to have both.  To illustrate, here’s a random sample of 10,000 “people” with independent normally distributed work ethic and talent (each with a mean of 0, standard deviation of 1):

image

The blue dots (left axis) are simply Hard Work plotted against Talent.  The red dots (right axis) are Hard Work plotted against the sum of Hard Work and Talent—call it “total awesome factor” or “success” or whatever.  Now let’s try a little Bayes’ Theorem intuition check:  You randomly select a person and they have an awesome factor of +5.  What are the odds that they have a work ethic of better than 2 standard deviations above the mean?  High?  Does this prove that all of the successful people are just hard workers in disguise?

Hint: No.  And this illustration is conservative:  This sample is only 10,000 strong: increase to 10 billion, and the biggest outliers will be even more uniformly even harder workers (and they will all be extremely talented as well).  Moreover, this “model” for greatness is just a sum of the two variables, when in reality it is probably closer to a product, which would lead to even greater disparities.  E.g.: I imagine total greatness achieved might be something like great stuff produced per minute worked (a function of talent) times total minutes worked (a function of willpower, determination, fortitude, blah blah, etc).

The general problem with Gladwell I think is that his emphatic de-emphasis of talent (which has no evidence backing it up) cheapens his much stronger underlying observation that for any individual to fully maximize their potential takes the accumulation of a massive amount of hard work—and this is true for people regardless of what their full potential may be.  Of course, this could just be a shrewd marketing ploy on his part: you probably sell more books by selling the hope of greatness rather than the hope of being an upper-level mid-manager (especially since you don’t have to worry about that hope going unfulfilled for at least 10 years).

Read the rest of this entry »

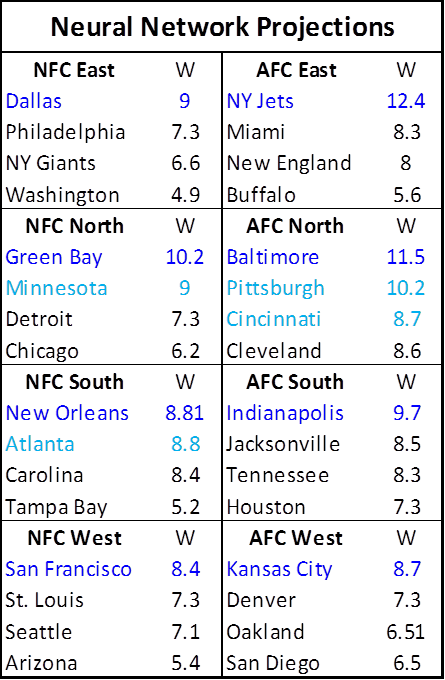
UPDATE: 2010 NFL Season Neural Network Projections—In Review

Before the start of the 2010 NFL season, I used a very simple neural network to create this set of last-second projections:

Neural-Network-Predictions_26378_image001

Clearly, some of the predictions worked out better than others.  E.g., Kansas City did manage to win their division (which I never would have guessed), but Dallas and San Francisco continued to make mockeries of their past selves.  We did come dangerously close to a Jets/Packers Super Bowl, but in the end, SkyNet turned out to be more John Edwards than Nostradamus.

From a prediction-tracking standpoint, the real story of this season was the stunning about-face performance of Football Outsiders, who dominated the regular season basically from start to finish:

image

Note: Average and Median Errors reflect the difference between projected and actual wins.  Correlations are between projected and actual win percentages.

Not only did they almost completely flip the results from 2009, but their stellar 2010 results (combined with the below-average outing of my model) actually pushed their last 3 seasons slightly ahead of the neural network overall.  This improvement also puts Koko (.25 * previous season’s wins + 6) far in FO’s rearview, providing further evidence that Koko’s 2009 success was a blip.

If we use each method’s win projections to project the post-season as well, however, things turn out a bit differently.  Football Outsiders starts out in a strong position, having correctly picked 4 of 8 division champions and 9 of 12 playoff teams overall (against 2 and 8 for the NN respectively), but their performance worsens as the playoffs unfold:

image

The neural network correctly placed Green Bay in the Super Bowl and the Jets into the AFC championship game, while FO’s final 4 were Atlanta over Green Bay and Baltimore over Indianapolis.

Moreover, if we use these preseason projections to pick the overall results of the playoffs as they were actually set, the neural network outperforms its rivals by a wide margin:

image

Note: The error measured in this table is between predicted finish and actual finish.  The Super Bowl winner finishes in 1st place, the loser in 2nd place, conference championship losers each tie for 3.5th place (average of 3rd and 4th), divisional losers tie for 6.5th (average of 5th, 6th, 7th, and 8th), and wild card round losers tie for 10.5th (average of 9th, 10th, 11th, and 12th).

This minor victory will give me some satisfaction when I retool the model for next season—after all, this model is still essentially based on a small fraction of the variables used by its competitor, and neural networks generally get better and better with more data.  On balance, though, the season clearly goes to Football Outsiders.  So credit where it’s due, and congratulations to humankind for putting the computers in their place, at least for one more year.

The Aesthetic Case Against 18 Games

By most accounts, the NFL’s plan to expand the regular season from 16 to 18 games is a done deal.  Indulge me for a moment as I take off my Bill-James-Wannabe cap and put on my dusty old Aristotle-Wannabe kausia:  In addition to various practical drawbacks, moving to 18 games risks disturbing the aesthetic harmony—grounded in powerful mathematics—inherent in the 16 game season.
Analytically, it is easy to appreciate the convenience of having the season break down cleanly into 8-game halves and 4-game quarters.  Powers of 2 like this are useful and aesthetically attractive: after all, we are symmetrical creatures who appreciate divisibility.  But we have a possibly even more powerful aesthetic attachment to certain types of asymmetrical relationships:  Mozart’s piano concertos aren’t divided into equally-sized beginnings, middles and ends.  Rather, they are broken into exposition, development, and recapitulation—each progressively shorter than the last.

Similarly, the 16 game season can fairly cleanly be broken into 3 or 4 progressively shorter but more important sections.  Using roughly the same proportions that Mozart would, the first 10 games (“exposition”) would set the stage and reveal who we should be paying attention to; the next 3-4 games (“development”) would be where the race for playoff positioning really begins in earnest, and the final 2-3 weeks (“recapitulation”) are where hopes are realized and hearts are broken—including the final weekend when post-season fates are settled.  Now, let’s represent the season as a rectangle with sides 16 (length of the season) and 10 (length of the “exposition”), broken down into consecutively smaller squares representing each section:

image

Note: The “last” game gets the leftover space, though if the season were longer we could obviously keep going.

At this point many of you probably know where this is going: The ratio between each square to all of the smaller pieces is roughly equal, corresponding to the “divine proportion,” which is practically ubiquitous in classical music, as well as in everything from book and movie plots to art and architecture to fractal geometry to unifying theories of “all animate and inanimate systems.”  Here it is again (incredibly clumsily-sketched) in the more recognizable spiral form:

image

The golden ratio is represented in mathematics by the irrational constant phi, which is:

1.6180339887…

Which, when divided into 1 gets you:

.6180339887…

Beautiful, right? So the roughly 10/4/1/1 breakdown above is really just 16 multiplied by 1/phi, with the remainder multiplied by 1/phi, etc—9.9, 3.8, 1.4, .9—rounded to the nearest game.  Whether this corresponds to your thinking about the relative significance of each portion of the season is admittedly subjective.  But this is an inescapably powerful force in aesthetics (along with symmetricality and symbols of virility and fertility), and can be found in places most people would never suspect, including in professional sports.  Let’s consider some anecdotal supporting evidence:

  • The length of a Major League Baseball season is 162 games.  Not 160, but 162.  That should look familiar.
  • Both NBA basketball and NHL hockey have 82-game seasons, or roughly half-phi.  Note 81 games would be impractical, because of need for equal number of home and road games (but bonus points if you’ve ever felt like the NBA season was exactly 1 game too long).
  • The “exposition” portion of a half-phi season would be 50 games.  The NHL and NBA All-Star breaks both take place right around game 50, or a little later, each year.
  • Though still solidly in between 1/2 and 2/3 of the way through the season, MLB’s “Summer Classic” usually takes place slightly earlier, around game 90 (though I might submit that the postseason crunch doesn’t really start until after teams build a post-All Star record for people to talk about).
  • The NFL bye weeks typically end after week 10.
  • Fans and even professional sports analysts are typically inclined to value “clutch” players—i.e., those who make their bones in the “Last” quadrant above—way more than a non-aesthetic analytical approach would warrant.

Etc.
So fine, say you accept this argument about how people observe sports, your next question may be: well, what’s wrong with 18 games? any number of games can be divided into phi-sized quadrants, right?  Well, the answer is basically yes, it can, but it’s not pretty:

image

The numbers 162, 82, and 16 all share a couple of nice qualities: first they are all roughly divisible by 4, so you have nice clean quarter-seasons.  Second, they each have aesthetically pleasing “exposition” periods: 100 games in MLB, 50 in the NBA and NHL, and 10 in the NFL.  The “exposition” period in an 18-game season would be 11 games.  Yuck!  These season-lengths balance our competing aesthetic desires for the harmony of symmetry and excitement of asymmetry.  We like our numbers round, but not too round.  We want them dynamic, but workable.

Finally, as to why the NFL should care about vague aesthetic concerns that it takes a mathematician to identify, I can only say: I don’t think these patterns would be so pervasive in science, art, and in broader culture if they weren’t really important to us, whether we know it or not.  Human beings are symmetrical down the middle, but as some guy in Italy noticed, golden rectangles are not only woven into our design, but into the design of the things we love.  Please, NFL, don’t take that away from us.

C.R.E.A.M. (Or, “How to Win a Championship in Any Sport”)

Does cash rule everything in professional sports?  Obviously it keeps the lights on, and it keeps the best athletes in fine bling, but what effect does the root of all evil have on the competitive bottom line—i.e., winning championships?

For this article, let’s consider “economically predictable” a synonym for “Cash Rules”:  I will use extremely basic economic reasoning and just two variables—presence of a salary cap and presence of a salary max in a sport’s labor agreement—to establish, ex ante, which fiscal strategies we should expect to be the most successful.  For each of the 3 major sports, I will then suggest (somewhat) testable hypotheses, and attempt to examine them.  If the hypotheses are confirmed, then Method Man is probably right—dollar dollar bill, etc.

Conveniently, on a basic yes/no grid of these two variables, our 3 major sports in the U.S. fall into 3 different categories:

image

So before treating those as anything but arbitrary arrangements of 3 letters, we should consider the dynamics each of these rules creates independently.  If your sport has a team salary cap, getting “bang for your buck” and ferreting out bargains is probably more important to winning than overall spending power.  And if your sport has a low maximum individual salary, your ability to obtain the best possible players—in a market where everyone knows their value but must offer the same amount—will also be crucial.  Considering permutations of thriftiness and non-economic acquisition ability, we end up with a simple ex ante strategy matrix that looks like this:

image

These one-word commandments may seem overly simple—and I will try to resolve any ambiguity looking at the individual sports below—but they are only meant to describe the most basic and obvious economic incentives that salary caps and salary maximums should be expected to create in competitive environments.

Major League Baseball: Spend

Hypothesis:  With free-agency, salary arbitration, and virtually no payroll restrictions, there is no strategic downside to spending extra money.  Combined with huge economic disparities between organizations, this means that teams that spend the most will win the most.

Analysis:  Let’s start with the New York Yankees (shocker!), who have been dominating baseball since 1920, when they got Babe Ruth from the Red Sox for straight cash, homey.  Note that I take no position on whether the Yankees filthy lucre is destroying the sport of Baseball, etc.  Also, I know very little about the Yankees payroll history, prior to 1988 (the earliest the USA Today database goes).  But I did come across this article from several years ago, which looks back as far as 1977.  For a few reasons, I think the author understates the case.  First, the Yankees low-salary period came at the tail end of a 12 year playoff drought (I don’t have the older data to manipulate, but I took the liberty to doodle on his original graph):

image

Note: Smiley-faces are Championship seasons.  The question mark is for the 1994 season, which had no playoffs.

Also, as a quirk that I’ve discussed previously, I think including the Yankees in the sample from which the standard deviation is drawn can be misleading: they have frequently been such a massive outlier that they’ve set their own curve.  Comparing the Yankees to the rest of the league, from last season back to 1988, looks like this:

image

Note: Green are Championship seasons.  Red are missed playoffs.

In 2005 the rest-of-league average payroll was ~$68 million, and the Yankees’ was ~$208 million (the rest-of-league standard deviation was $23m, but including the Yankees, it would jump to $34m).

While they failed to win the World Series in some of their most expensive seasons, don’t let that distract you:  money can’t guarantee a championship, but it definitely improves your chances.  The Yankees have won roughly a quarter of the championships over the last 20 years (which is, astonishingly, below their average since the Ruth deal).  But it’s not just them.  Many teams have dramatically increased their payrolls in order to compete for a World Series title—and succeeded! Over the past 22 years, the top 3 payrolls (per season) have won a majority of titles:

image

As they make up only 10% of the league, this means that the most spendy teams improved their title chances, on average, by almost a factor of 6.

National Basketball Association: Recruit (Or: “Press Your Bet”)

Hypothesis:  A fairly strict salary cap reigns in spending, but equally strict salary regulations mean many teams will enjoy massive surplus value by paying super-elite players “only” the max.  Teams that acquire multiple such players will enjoy a major championship advantage.

Analysis: First, in case you were thinking that the 57% in the graph above might be caused by something other than fiscal policy, let’s quickly observe how the salary cap kills the “spend” strategy: image

Payroll information from USA Today’s NBA and NFL Salary Databases (incidentally, this symmetry is being threatened, as the Lakers, Magic, and Mavericks have the top payrolls this season).

I will grant there is a certain apples-to-oranges comparison going on here: the NFL and NBA salary-cap rules are complex and allow for many distortions.  In the NFL teams can “clump” their payroll by using pro-rated signing bonuses (essentially sacrificing future opportunities to exceed the cap in the present), and in the NBA giant contracts are frequently moved to bad teams that want to rebuild, etc.  But still: 5%.  Below expectation if championships were handed out randomly.
And basketball championships are NOT handed out randomly.  My hypothesis predicts that championship success will be determined by who gets the most windfall value from their star player(s).  Fifteen of the last 20 NBA championships have been won by Kobe Bryant, Tim Duncan, or Michael Jordan.  Clearly star-power matters in the NBA, but what role does salary play in this?

Prior to 1999, the NBA had no salary maximum, though salaries were regulated and limited in a variety of ways.  Teams had extreme advantages signing their own players (such as Bird rights), but lack of competition in the salary market mostly kept payrolls manageable.  Michael Jordan famously signed a lengthy $25 million contract extension basically just before star player salaries exploded, leaving the Bulls with the best player in the game for a song (note: Hakeem Olajuwon’s $55 million payday came after he won 2 championships as well).  By the time the Bulls were forced to pay Jordan his true value, they had already won 4 championships and built a team around him that included 2 other All-NBA caliber players (including one who also provided extreme surplus value).  Perhaps not coincidentally, year 6 in the graph below is their record-setting 72-10 season:
image

Note: Michael Jordan’s salary info found here.  Historical NBA salary cap found here.

The star player salary situation caught the NBA off-guard.  Here’s a story from Time magazine in 1996 that quotes league officials and executives:

“It’s a dramatic, strategic judgment by a few teams,” says N.B.A. deputy commissioner Russ Granik. .
Says one N.B.A. executive: “They’re going to end up with two players making about two-thirds of the salary cap, and another pair will make about 20%. So that means the rest of the players will be minimum-salary players that you just sign because no one else wants them.” . . .
Granik frets that the new salary structure will erode morale. “If it becomes something that was done across the league, I don’t think it would be good for the sport,” he says.

What these NBA insiders are explaining is basic economics:  Surprise!  Paying better players big money means less money for the other guys.  Among other factors, this led to 2 lockouts and the prototype that would eventually lead to the current CBA (for more information than you could ever want about the NBA salary cap, here is an amazing FAQ).

The fact that the best players in the NBA are now being underpaid relative to their value is certain.  As a back of the envelope calculation:  There are 5 players each year that are All-NBA 1st team, while 30+ players each season are paid roughly the maximum.  So how valuable are All-NBA 1st team players compared to the rest?  Let’s start with: How likely is an NBA team to win a championship without one?

image

In the past 20 seasons, only the 2003-2004 Detroit Pistons won the prize without a player who was a 1st-Team All-NBAer in their championship year.
To some extent, these findings are hard to apply strategically.  All but those same Pistons had at least one home-grown All-NBA (1st-3rd team) talent—to win, you basically need the good fortune to catch a superstar in the draft.  If there is an actionable take-home, however, it is that most (12/20) championship teams have also included a second All-NBA talent acquired through trade or free agency: the Rockets won after adding Clyde Drexler, the second Bulls 3-peat added Dennis Rodman (All-NBA 3rd team with both the Pistons and the Spurs), the Lakers and Heat won after adding Shaq, the Celtics won with Kevin Garnett, and the Lakers won again after adding Pau Gasol.

Each of these players was/is worth more than their market value, in most cases as a result of the league’s maximum salary constraints.  Also, in most of these cases, the value of the addition was well-known to the league, but the inability of teams to outbid each other meant that basketball money was not the determinant factor in the players choosing their respective teams.  My “Recruit” strategy anticipated this – though it perhaps understates the relative importance of your best player being the very best.  This is more a failure of the “recruit” label than of the ex ante economic intuition, the whole point of which was that cap+max –> massive importance of star players.

National Football League: Economize (Or: “WWBBD?”)

Hypothesis:  The NFL’s strict salary cap and lack of contract restrictions should nullify both spending and recruiting strategies.  With elite players paid closer to what they are worth, surplus value is harder to identify.  We should expect the most successful franchises to demonstrate both cunning and wise fiscal policy.

Analysis: Having a cap and no max salaries is the most economically efficient fiscal design of any of the 3 major sports.  Thus, we should expect that massively dominating strategies to be much harder to identify.  Indeed, the dominant strategies in the other sports are seemingly ineffective in the NFL: as demonstrated above, there seems to be little or no advantage to spending the most, and the abundant variance in year-to-year team success in the NFL would seem to rule out the kind of individual dominance seen in basketball.

Thus, to investigate whether cunning and fiscal sense are predominant factors, we should imagine what kinds of decisions a coach or GM would make if his primary qualities were cunning and fiscal sensibility.  In that spirit, I’ve come up with a short list of 5 strategies that I think are more or less sound, and that are based largely on classically “economic” considerations:

1.  Beg, borrow, or steal yourself a great quarterback:
Superstar quarterbacks are probably underpaid—even with their monster contracts—thus making them a good potential source for surplus value.  Compare this:

Note: WPA (wins added) stats from here.

With this:

The obvious caveat here is that the entanglement question is still empirically open:  How much do good QB’s make their teams win v. How much do winning teams make their QB’s look good?  But really quarterbacks only need to be responsible for a fraction of the wins reflected in their stats to be worth more than what they are being paid. (An interesting converse, however, is this: the fact that great QB’s don’t win championships with the same regularity as, say, great NBA players, suggests that a fairly large portion of the “value” reflected by their statistics is not their responsibility).

2. Plug your holes with the veteran free agents that nobody wants, not the ones that everybody wants:
If a popular free agent intends to go to the team that offers him the best salary, his market will act substantially like a “common value” auction.  Thus, beware the Winner’s Curse. In simple terms: If 1) a player’s value is unknown, 2) each team offers what they think the player is worth, and 3) each team is equally likely to be right; then: 1) The player’s expected value will correlate with the average bid, and 2) the “winning” bid probably overpaid.

Moreover, even if the winner’s bid is exactly right, that just means they will have successfully gained nothing from the transaction.  Assuming equivalent payrolls, the team with the most value (greatest chance of winning the championship) won’t be the one that pays the most correct amount for its players, it will—necessarily—be the one that pays the least per unit of value.  To accomplish this goal, you should avoid common value auctions as much as possible!  In free agency, look for the players with very small and inefficient markets (for which #3 above is least likely to be true), and then pay them as little as you can get away with.

3. Treat your beloved veterans with cold indifference.
If a player is beloved, they will expect to be paid.  If they are not especially valuable, they will expect to be paid anyway, and if they are valuable, they are unlikely to settle for less than they are worth.  If winning is more important to you than short-term fan approval, you should be both willing and prepared to let your most beloved players go the moment they are no longer a good bargain.

4. Stock up on mid-round draft picks.
Given the high cost of signing 1st round draft picks, 2nd round draft picks may actually be more valuable.  Here is the crucial graph from the Massey-Thaler study of draft pick value (via Advanced NFL Stats):

image
The implications of this outcome are severe.  All else being equal, if someone offers you an early 2nd round draft pick for your early 1st round draft pick, they should be demanding compensation from you (of course, marginally valuable players have diminishing marginal value, because you can only have/play so many of them at a time).

5. When the price is right: Gamble.

This rule applies to fiscal decisions, just as it does to in-game ones.  NFL teams are notoriously risk-averse in a number of areas: they are afraid that someone after one down season is washed up, or that an outspoken player will ‘disrupt’ the locker room, or that a draft pick might have ‘character issues’.  These sorts of questions regularly lead to lengthy draft slides and dried-up free agent markets.  And teams are right to be concerned: these are valid possibilities that increase uncertainty.  Of course, there are other possibilities. Your free agent target simply may not be as good as you hope they are, or your draft pick may simply bust out.  Compare to late-game 4th-down decisions: Sometimes going for it on 4th down will cause you to lose immediately and face a maelstrom of criticism from fans and press, where punting or kicking may quietly lead to losing more often.  Similarly, when a team takes a high-profile personnel gamble and it fails, they may face a maelstrom of criticism from fans and press, where the less controversial choice might quietly lead to more failure.

The economizing strategy here is to favor risks when they are low cost but have high upsides.  In other words, don’t risk a huge chunk of your cap space on an uncertain free agent prospect, risk a tiny chunk of your cap space on an even more uncertain prospect that could work out like gangbusters.

Evaluation:

Now, if only there were a team and coach dedicated to these principles—or at least, for contrapositive’s sake, a team that seemed to embrace the opposite.

Oh wait, we have both!  In the last decade, Bill Belichick and the New England Patriots have practically embodied these principles, and in the process they’ve won 3 championships, have another 16-0/18-1 season, have set the overall NFL win-streak records, and are presently the #1 overall seed in this year’s playoffs. OTOH, the Redskins have practically embodied the opposite, and they have… um… not.
Note that the Patriots’ success has come despite a league fiscal system that allows teams to “load up” on individual seasons, distributing the cost onto future years (which, again, helps explain the extreme regression effect present in the NFL).  Considering the long odds of winning a Super Bowl—even with a solid contender—this seems like an unwise long-run strategy, and the most successful team of this era has cleverly taken the long view throughout.

Conclusions

The evidence in MLB and in the NBA is ironclad: Basic economic reasoning is extremely probative when predicting the underlying dynamics behind winning titles.  Over the last 20 years of pro baseball, the top 3 spenders in the league each year win 57% of the championships.  Over a similar period in basketball, the 5 (or fewer) teams with 1st-Team All-NBA players have won 95%.

In the NFL, the evidence is more nuance and anecdote than absolute proof.  However, our ex ante musing does successfully predict that neither excessive spending nor recruiting star players at any cost (excepting possibly quarterbacks) is a dominant strategy.

On balance, I would say that the C.R.E.A.M. hypothesis is substantially more supported by the data than I would have guessed.

UPDATE: Advanced NFL Stats Admits I Was Right. Sort Of.

Background:  In January, long before I started blogging in earnest, I made several comments on this Advanced NFL Stats post that were critical of Brian Burke’s playoff prediction model, particularly that, with 8 teams left, it predicted that the Dallas Cowboys had about the same chance of winning the Super Bowl as the Jets, Ravens, Vikings, and Cardinals combined. This seemed both implausible on its face and extremely contrary to contract prices, so I was skeptical.  In that thread, Burke claimed that his model was “almost perfectly calibrated. Teams given a 0.60 probability to win do win 60% of the time, teams given a 0.70 probability win 70%, etc.”  I expressed interest in seeing his calibration data, ”especially for games with considerable favorites, where I think your model overstates the chances of the better team,” but did not get a response.

I brought this dispute up in my monstrously-long passion-post, “Applied Epistemology in Politics and the Playoffs,” where I explained how, even if his model was perfectly calibrated, it would still almost certainly be underestimating the chances of the underdogs.  But now I see that Burke has finally posted the calibration data (compiled by a reader from 2007 on).  It’s a very simple graph, which I’ve recreated here, with a trend-line for his actual data:

image

Now I know this is only 3+ years of data, but I think I can spot a trend:  for games with considerable favorites, his model seems to overstate the chances of the better team.  Naturally, Burke immediately acknowledges this error:

On the other hand, there appears to be some trends. the home team is over-favored in mismatches where it is the stronger team and is under-favored in mismatches where it is the weaker team. It’s possible that home field advantage may be even stronger in mismatches than the model estimates.

Wait, what? If the error were strictly based on stronger-than-expected home-field advantage, the red line should be above the blue line, as the home team should win more often than the model projects whether it is a favorite or not – in other words, the actual trend-line would be parallel to the “perfect” line but with a higher intercept.  Rather, what we see is a trend-line with what appears to be a slightly higher intercept but a somewhat smaller slope, creating an “X” shape, consistent with the model being least accurate for extreme values.  In fact, if you shifted the blue line slightly upward to “shock” for Burke’s hypothesized home-field bias, the “X” shape would be even more perfect: the actual and predicted lines would cross even closer to .50, while diverging symmetrically toward the extremes.

Considering that this error compounds exponentially in a series of playoff games, this data (combined with the still-applicable issue I discussed previously), strongly vindicates my intuition that the market is more trustworthy than Burke’s playoff prediction model, at least when applied to big favorites and big dogs.

Yes ESPN, Professional Kickers are Big Fat Chokers

A couple of days ago, ESPN’s Peter Keating blogged about “icing the kicker” (i.e., calling timeouts before important kicks, sometimes mere instants before the ball is snapped).  He argues that the practice appears to work, at least in overtime.  Ultimately, however, he concludes that his sample is too small to be “statistically significant.”  This may be one of the few times in history where I actually think a sports analyst underestimates the probative value of a small sample: as I will show, kickers are generally worse in overtime than they are in regulation, and practically all of the difference can be attributed to iced kickers.  More importantly, even with the minuscule sample Keating uses, their performance is so bad that it actually is “significant” beyond the 95% level.

In Keating’s 10 year data-set, kickers in overtime only made 58.1% of their 35+ yard kicks following an opponent’s timeout, as opposed to 72.7% when no timeout was called.  The total sample size is only 75 kicks, 31 of which were iced.  But the key to the analysis is buried in the spreadsheet Keating links to: the average length of attempted field goals by iced kickers in OT was only 41.87 yards, vs. 43.84 yards for kickers at room temperature.  Keating mentions this fact in passing, mainly to address the potential objection that perhaps the iced kickers just had harder kicks — but the difference is actually much more significant.
To evaluate this question properly, we first need to look at made field goal percentages broken down by yard-line.  I assume many people have done this before, but in 2 minutes of googling I couldn’t find anything useful, so I used play-by-play data from 2000-2009 to create the following graph:

image

The blue dots indicate the overall field-goal percentage from each yard-line for every field goal attempt in the period (around 7500 attempts total – though I’ve excluded the one 76 yard attempt, for purely aesthetic reasons).  The red dots are the predicted values of a logistic regression (basically a statistical tool for predicting things that come in percentages) on the entire sample.  Note this is NOT a simple trend-line — it takes every data point into account, not just the averages.  If you’re curious, the corresponding equation (for predicted field goal percentage based on yard line x) is as follows:

 \large{1 - \dfrac{e^{-5.5938+0.1066x}} {1+e^{-5.5938+0.1066x}}}

The first thing you might notice about the graph is that the predictions appear to be somewhat (perhaps unrealistically) optimistic about very long kicks.  There are a number of possible explanations for this, chiefly that there are comparatively few really long kicks in the sample, and beyond a certain distance the angle of the kick relative to the offensive and defensive linemen becomes a big factor that is not adequately reflected by the rest of the data (fortunately, this is not important for where we are headed).  The next step is to look at a similar graph for overtime only — since the sample is so much smaller, this time I’ll use a bubble-chart to give a better idea of how many attempts there were at each distance:

image

For this graph, the sample is about 1/100th the size of the one above, and the regression line is generated from the OT data only.  As a matter of basic spatial reasoning — even if you’re not a math whiz — you may sense that this line is less trustworthy.  Nevertheless, let’s look at a comparison of the overall and OT-based predictions for the 35+ yard attempts only:

image

Note: These two lines are slightly different from their counterparts above.  To avoid bias created by smaller or larger values, and to match Keating’s sample, I re-ran the regressions using only 35+ yard distances that had been attempted in overtime (they turned out virtually the same anyway).

Comparing the two models, we can create a predicted “Choke Factor,” which is the percentage of the original conversion rate that you should knock off for a kicker in an overtime situation:

image

A weighted average (by the number of OT attempts at each distance) gives us a typical Choke Factor of just over 6%.  But take this graph with a grain of salt: the fact that it slopes upward so steeply is a result of the differing coefficients in the respective regression equations, and could certainly be a statistical artifact.  For my purposes however, this entire digression into overtime performance drop-offs is merely for illustration:  The main calculation relevant to Keating’s iced kick discussion is a simple binomial probability:  Given an average kick length of 41.87 yards, which carries a predicted conversion rate of 75.6%, what are the odds of converting only 18 or fewer out of 31 attempts?  OK, this may be a mildly tricky problem if you’re doing it longhand, but fortunately for us, Excel has a BINOM.DIST() function that makes it easy:

image

Note : for people who might not pick:  Yes, the predicted conversion rate for the average length is not going to be exactly the same as the average predicted value for the length of each kick.  But it is very close, and close enough.

As you can see, the OT kickers who were not iced actually did very slightly better than average, which means that all of the negative bias observed in OT kicking stems from the poor performance seen in just 31 iced kick attempts.  The probability of this result occurring by chance — assuming the expected conversion rate for OT iced kicks were equal to the expected conversion rate for kicks overall — would be only 2.4%.  Of course, “probability of occurring by chance” is the definition of statistical significance, and since 95% against (i.e., less than 5% chance of happening) is the typical threshold for people to make bold assertions, I think Keating’s statement that this “doesn’t reach the level of improbability we need to call it statistically significant” is unnecessarily humble.  Moreover, when I stated that the key to this analysis was the 2 yard difference that Keating glossed over, that wasn’t for rhetorical flourish:  if the length of the average OT iced kick had been the same as the length of the average OT regular kick,  the 58.1% would correspond to a “by chance” probability of 7.6%, obviously not making it under the magic number.