The sports analytical community has long used Margin of Victory or similar metrics as their core component for predicting future outcomes. In situations with relatively small samples, it generally slightly outperforms win percentages, even when predicting win percentages.
There are several different methods for converting MOV into expected win-rates. For this series, I took the 55,000+ regular-season team games played since 1986 and compared their outcomes to the team’s Margin of Victory over the other 81 games of the season. I then ran this data through a logistic regression (a method for predicting things that come in percentages) with MOV as the predictor variable. Here is the resulting formula:
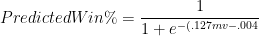
Note: e is euler’s number, or ~2.72. mv is the variable for margin of victory.
This will return the probability between 0 and 1, corresponding to the odds of winning the predicted game. If you want to try it out for yourself, the excel formula is:
1 / (1 + EXP(-(-0.0039+0.1272*[MOV])))
So, for example, if a team’s point differential (MOV) over 81 games is 3.78 points per game, their odds of winning their 82nd game would be 61.7%.
Of course, we can use this same formula to predict a player’s win% differential based on his MOV differential. If, based on his MOV contribution alone, a player’s team would be expected to win 61.7% of the time, then his predicted win% differential is what his contribution would be above average, in this case 11.7% (this is one reason why, for comparison purposes, I prefer to use adjusted win differentials, as discussed in Part 3(a)).
As discussed in the part 2(b) of this series (“With or Without Worm”), Dennis Rodman’s MOV differential was 3.78 points, which was tops among players with at least a season’s worth of qualifying data, corresponding to the aforementioned win differential of 11.7%. Yet this under-predicts his actual win percentage differential by 9.9%. This could be the result of a miscalibrated prediction formula, but as you can see in the following histogram, the mean for win differential minus predicted win differential for our 470 qualifying player dataset is actually slightly below zero at –0.7%:

Rodman has the 2nd highest overall, which is even more crazy considering that he had one of the highest MOV’s (and the highest of anyone with anywhere close to his sample size) to begin with. Note how much of an outlier he is in this scatterplot (red dot is Rodman):

I call this difference the “X-Factor.” For my purposes, “X” stands for “unknown”: That is, it is the amount of a player’s win differential that isn’t explained by the most common method for predicting win percentages. For any particular player, it may represent an actual skill for winning above and beyond a player’s ability to contribute to his team’s margin of victory (in section (c), I will go about proving that such a skill exists), or it may simply be a result of normal variance. But considering that Rodman’s sample size is significantly larger than the average in our dataset, the chances of it being “error” should be much smaller. Consider the following:

Again, Rodman is a significant outlier: no one with more than 2500 qualifying minutes breaks 7.5%. Rodman’s combination of large sample with large Margin of Victory differential with large X-Factor is remarkable. To visualize this, I’ve put together a 3-D scatter plot of all 3 variables:

It can be hard to see where a point stands in space in a 2-D image, but I’ve added a surface grid to try to help guide you: the red point on top of the red mountain is Dennis Rodman.
To get a useful measure of how extreme this is, we can approximate a sample-size adjustment by comparing the number of qualifying minutes for each player to the average for the dataset, and then adjusting the standard deviation for that player accordingly (proportional to the square root of the ratio, a method which I’ll discuss in more detail in section (d)). After doing this, I can re-make the same histogram as above with the sample-adjusted numbers:
No man is an island. Except, apparently, for Dennis Rodman. Note that he is about 4 standard deviations above the mean (and observe how the normal distribution line has actually blended with the axis below his data point).
Naturally, of course, this raises the question:
Where does Rodman’s X-Factor come from?
Strictly speaking, what I’m calling “X-Factor” is just the prediction error of this model with respect to players. Some of that error is random and some of it is systematic. In section (c), I will prove that it’s not entirely random, though where it comes from for any individual player, I can only speculate.
Margin of Victory treats all contributions to a game’s point spread equally, whether they came at the tail end of a blowout, or in the final seconds of squeaker. One thing that could contribute to a high X-factor is “clutch”ness. A “clutch” shooter (like a Robert Horry), for example, might be an average or even slightly below-average player for most of the time he is on the floor, but an extremely valuable one near the end of games that could go either way. The net effect from the non-close games would be small for both metrics, but the effect of winning close games would be much higher on Win% than MOV. Of course, “clutch”ness doesn’t have to be limited to shooters: e.g., if one of a particular player’s skill advantages over the competition is that he makes better tactical decisions near the end of close games (like knowing when to intentionally foul, etc.), that would reflect much more strongly in his W% than in his MOV.
Also, a player who contributes significantly whenever they are on the floor but is frequently taken out of non-close games as a precaution again fatigue or injury may have a Win % that accurately reflects his impact, but a significantly understated MOV. E.g., in the Boston Celtics “Big 3” championship season, Kevin Garnett was rested constantly—a fact that probably killed his chances of being that season’s MVP—yet the Celtics won by far the most games in the league. In this case, the player is “clutch” just by virtue of being on the floor more in clutch spots.
The converse possibility also exists: A player could be “reverse clutch,” meaning that he plays worse when the game is NOT on the line. This would ultimately have the same statistical effect as if he played better in crunch time. And indeed, based on completely non-rigorous and anecdotal speculation, I think this is a possible factor in Rodman’s case. During his time in Chicago, I definitely recall him doing a number of silly things in the 4th quarter of blowout games (like launching up ridiculous 3-pointers) when it didn’t matter—and in a game of small margins, these things add up.
Finally, though it cuts a small amount against the absurdity of Rodman’s rebounding statistics, I would be derelict as an analyst not to mention the possibility that Rodman may have played sub-optimally in non-close games in order to pad his rebounding numbers. The net effect, of course, would be that his rebounding statistics could be slightly overstated, while his value (which is already quite prodigious) could be substantially understated. To be completely honest, with his rebounding percentages and his X-Factor both being such extreme outliers, I have to think that at least some relationship existing between the two is likely.
If you’re emotionally attached to the freak-alien-rebounder hypothesis, this might seem to be a bad result for you. But if you’re interested in Rodman’s true value to the teams he played for, you should understand that, if this theory is accurate, it could put Rodman’s true impact on winning into the stratosphere. That is, this possibility gives no fuel to Rodman’s potential critics: the worst cases on either side of the spectrum are that Rodman was the sickest rebounder with a great impact on his teams, or that he was a great rebounder with the sickest impact.
In the next section, I will be examining the relative reliability and importance of Margin of Victory vs. Win % generally, across the entire league. In my “endgame” analysis, this is the balance of factors that I will use. But the league patterns do not necessarily apply in all situations: In some cases, a player’s X-factor may be all luck, in some cases it may be all skill, and in most it is probably a mixture of both. So, for example, if my speculation about Rodman’s X-Factor were true, my final analysis of Rodman’s value could be greatly understated.
Will you be getting an award for this series?
Ha! I’d be happy to get a few more readers.
It would be neat to see a sample of players in the 4 quadrants of predicted vs actual Win % Diff. For instance, who are some notable players from the group that were predicted to hurt their team but in fact helped, or vice versa, players who should have helped their team but in fact hurt their team. I think there would probably be to much noise to say anything conclusively for most players but it would be neat to see.
This is insanely awesome work. Keep it up.
Benjamin,
Love the Rodman research. I’ve posed myself the following theoretical idea. You get 8 people in a room, all posing as GM’s. We’re allowed to select 5 players each from the entire history of the NBA. Then we’ll have a tournament. At PF, I would grab Rodman. And I’m confident that I’d win because he’s on my team. He’d dominate the glass and harass and shutdown a superstar. I think he’s the finest PF to ever play the game.
Of course, you need to surround him with some scorers, but when is that ever a problem?
I actually had a serious discussion about this a while back. A very smart friend of mine is even more bullish on Rodman than I am, and has suggested that he may have been the most valuable player in NBA history. I don’t know the degree to which I buy it, but the argument is pretty simple: he agrees that Michael Jordan or others were probably more valuable directly, but that Rodman’s contribution relative to his role was unprecedented.
By analogy, consider an incredible kicker in the NFL that could earn his team 2 extra wins per season: such a player would easily be more valuable to potentially contending teams than a league-leading QB who earns his team 4 wins per season. This is because the next best kicker may get you only .5 wins (for a surplus of 1.5), while the next-best QB might get you 3.5 (for a difference of only .5).
And his ultimate point was almost exactly the same as yours: if we’re doing an all-time draft and you took Jordan and I took Rodman, I could always get good contributing scorers from my picks at other positions, but you would be hard-pressed to get that much impact from any other exclusive defender-rebounder.
Another way of looking at it is how much the player contributes relative to the amount of team “usage” he consumes (I mean “usage” as the broader concept, not the exact stat that goes by that name). I can imagine some interesting research to be done in that area. I’ll keep it in mind.
I was watching part of Game 6 of the 1996 nba finals on youtube. In the third quater from 9 minutes left until 6 minutes left. Best three minutes of Rodmans career. Two steals , five points, assist, off rebound and something that doesnt show up in boxscore. Seattle lost possesion twice in those three minutes because hawkins and kemp each shoved rodman to the floor drawing a foul. Chicago got the ball same as a steal or defensive rebound. Leading to two jordan scores. I am sure that happened to Rodman many times as he got under opponents skin. An X factor because it doesnt show up in Rodman stats
I can see how Rodman’s contribution relative to his role might make him the first pick in a hypothetical game of all-time greats (or even in an NBA all-star game), but I doubt the same holds for a thirty team league with a limited number of stars. To return to your analogy about contending NFL teams, the only scenario in which the superhuman placekicker is more valuable than the star qb is if the alternative to the star qb is also very, very good (and there are maybe 5 very good qbs at any given time). If the alternative is a mediocre passer who’s worth maybe 1 win per season, or a half win per season, then obviously, having the star qb is better than having the superhuman placekicker.
I might rather have Kobe Bryant and Rodman than Jordan and, say, Draymond Green (and the difference between Kobe and Jordan is sizable, as you or anyone who studies hoops knows), but I would DEFINITELY rather have Jordan and an average power forward than Jerry Stackhouse and the worm.