Sports Geek Mecca: Recap and Thoughts, Part 2

This is part 2 of my “recap” of the Sloan Sports Analytics Conference that I attended in March (part 1 is here), mostly covering Day 2 of the event, but also featuring my petty way-too-long rant about Bill James (which I’ve moved to the end).

Day Two

First I attended the Football Analytics despite finding it disappointing last year, and, alas, it wasn’t any better. Eric Mangini must be the only former NFL coach willing to attend, b/c they keep bringing him back:

Overall, I spent more time in day 2 going to niche panels, research paper presentations and talking to people.

The last, in particular, was great. For example, I had a fun conversation with Henry Abbott about Kobe Bryant’s lack of “clutch.” This is one of Abbott’s pet issues, and I admit he makes a good case, particularly that the Lakers are net losers in “clutch” situations (yes, relative to other teams), even over the periods where they have been dominant otherwise.

Kobe is kind of a pivotal case in analytics, I think. First, I’m a big believer in “Count the Rings, Son” analysis: That is, leading a team to multiple championships is really hard, and only really great players do it. I also think he stands at a kind of nexus, in that stats like PER give spray shooters like him an unfair advantage, but more finely tuned advanced metrics probably over-punish the same. Part of the burden of Kobe’s role is that he has to take a lot of bad shots—the relevant question is how good he is at his job.

Abbott also mentioned that he liked one of my tweets, but didn’t know if he could retweet the non-family-friendly “WTF”:

I also had a fun conversation with Neil Paine of Basketball Reference. He seemed like a very smart guy, but this may be attributable to the fact that we seemed to be on the same page about so many things. Additionally, we discussed a very fun hypo: How far back in time would you have to go for the Charlotte Bobcats to be the odds-on favorites to win the NBA Championship?

As for the “sideshow” panels, they’re generally more fruitful and interesting than the ESPN-moderated super-panels, but they offer fewer easy targets for easy blog-griping. If you’re really interested in what went down, there is a ton of info at the SSAC website. The agenda can be found here. Information on the speakers is here. And, most importantly, videos of the various panels can be found here.

Box Score Rebooted

Featuring Dean Oliver, Bill James, and others.

This was a somewhat interesting, though I think slightly off-target, panel. They spent a lot of time talking about new data and metrics and pooh-poohing things like RBI (and even OPS), and the brave new world of play-by-play and video tracking, etc. But too much of this was discussing a different granularity of data than what can be improved in the current granularity levels. Or, in other words:

James acquitted himself a bit on this subject, arguing that boatloads of new data isn’t useful if it isn’t boiled down into useful metrics. But a more general way of looking at this is: If we were starting over from scratch, with a box-score-sized space to report a statistical game summary, and a similar degree of game-scoring resources, what kinds of things would we want to include (or not) that are different from what we have now?  I can think of a few:

  1. In basketball, it’s archaic that free-throws aren’t broken down into bonus free throws and shot-replacing free throws.
  2. In football, I’d like to see passing stats by down and distance, or at least in a few key categories like 3rd and long.
  3. In baseball, I’d like to see “runs relative to par” for pitchers (though this can be computed easily enough from existing box scores).

In this panel, Dean Oliver took the opportunity to plug ESPN’s bizarre proprietary Total Quarterback Rating. They actually had another panel devoted just to this topic, but I didn’t go, so I’ll put a couple of thoughts here.

First, I don’t understand why ESPN is pushing this as a proprietary stat. Sure, no-one knows how to calculate regular old-fashioned quarterback ratings, but there’s a certain comfort in at least knowing it’s a real thing. It’s a bit like Terms of Service agreements, which people regularly sign without reading: at least you know the terms are out there, so someone actually cares enough to read them, and presumably they would raise a stink if you had to sign away your soul.

As for what we do know, I may write more on this come football season, but I have a couple of problems:

One, I hate the “clutch effect.” TQBR makes a special adjustment to value clutch performance even more than its generic contribution to winning. If anything, clutch situations in football are so bizarre that they should count less. In fact, when I’ve done NFL analysis, I’ve often just cut the 4th quarter entirely, and I’ve found I get better results. That may sound crazy, but it’s a bit like how some very advanced Soccer analysts have cut goal-scoring from their models, instead just focusing on how well a player advances the ball toward his goal: even if the former matters more, its unreliability may make it less useful.

Two, I’m disappointed in the way they “assign credit” for play outcomes:

Division of credit is the next step. Dividing credit among teammates is one of the most difficult but important aspects of sports. Teammates rely upon each other and, as the cliché goes, a team might not be the sum of its parts. By dividing credit, we are forcing the parts to sum up to the team, understanding the limitations but knowing that it is the best way statistically for the rating.

I’m personally very interested in this topic (and have discussed it with various ESPN analytics guys since long before TQBR was released). This is basically an attempt to address the entanglement problem that permeates football statistics.  ESPN’s published explanation is pretty cryptic, and it didn’t seem clear to me whether they were profiling individual players and situations or had created credit-distribution algorithms league-wide.

At the conference, I had a chance to talk with their analytics guy who designed this part of the metric (his name escapes me), and I confirmed that they modeled credit distribution for the entire league and are applying it in a blanket way.  Technically, I guess this is a step in the right direction, but it’s purely a reduction of noise and doesn’t address the real issue.  What I’d really like to see is like a recursive model that imputes how much credit various players deserve broadly, then uses those numbers to re-assign credit for particular outcomes (rinse and repeat).

Deconstructing the Rebound With Optical Tracking Data

Rajiv Maheswaran, and other nerds.

This presentation was so awesome that I offered them a hedge bet for the “Best Research Paper” award. That is, I would bet on them at even money, so that if they lost, at least they would receive a consolation prize. They declined. And won. Their findings are too numerous and interesting to list, so you should really check it out for yourself.

Obviously my work on the Dennis Rodman mystery makes me particularly interested in their theories of why certain players get more rebounds than others, as I tweeted in this insta-hypothesis:

Following the presentation, I got the chance to talk with Rajiv for quite a while, which was amazing. Obviously they don’t have any data on Dennis Rodman directly, but Rajiv was also interested in him and had watched a lot of Rodman video. Though anecdotal, he did say that his observations somewhat confirmed the theory that a big part of Rodman’s rebounding advantage seemed to come from handling space very well:

  1. Even when away from the basket, Rodman typically moved to the open space immediately following a shot. This is a bit different from how people often think about rebounding as aggressively attacking the ball (or as being able to near-psychically predict where the ball is going to come down.
  2. Also rather than simply attacking the board directly, Rodman’s first inclination was to insert himself between the nearest opponent and the basket. In theory, this might slightly decrease the chances of getting the ball when it heads in toward his previous position, but would make up for it by dramatically increasing his chances of getting the ball when it went toward the other guy.
  3. Though a little less purely strategical, Rajiv also thought that Rodman was just incredibly good at #2. That is, he was just exceptionally good at jockeying for position.

To some extent, I guess this is just rebounding fundamentals, but I still think it’s very interesting to think about the indirect probabilistic side of the rebounding game.

Live B.S. Report with Bill James

Quick tangent: At one point, I thought Neil Paine summed me up pretty well as a “contrarian to the contrarians.”  Of course, I’m don’t think I’m contrary for the sake of contrariness, or that I’m a negative person (I don’t know how many times I’ve explained to my wife that just because I hated a movie doesn’t mean I didn’t enjoy it!), it’s just that my mind is naturally inclined toward considering the limitations of whatever is put in front of it. Sometimes that means criticizing the status quo, and sometimes that means criticizing its critics.

So, with that in mind, I thought Bill James’s showing at the conference was pretty disappointing, particularly his interview with Bill Simmons.

I have a lot of respect for James.  I read his Historical Baseball Abstract and enjoyed it considerably more than Moneyball.  He has a very intuitive and logical mind. He doesn’t say a bunch of shit that’s not true, and he sees beyond the obvious. In Saturday’s “Rebooting the Box-score” panel, he made an observation that having 3 of 5 people on the panel named John implied that the panel was [likely] older than the rest of the room.  This got a nice laugh from the attendees, but I don’t think he was kidding.  And whether he was or not, he still gets 10 kudos from me for making the closest thing to a Bayesian argument I heard all weekend.  And I dutifully snuck in for a pic with him:

James was somewhat ahead of his time, and perhaps he’s still one of the better sports analytic minds out there, but in this interview we didn’t really get to hear him analyze anything, you know, sportsy. This interview was all about Bill James and his bio and how awesome he was and how great he is and how hard it was for him to get recognized and how much he has changed the game and how, without him, the world would be a cold, dark place where ignorance reigned and nobody had ever heard of “win maximization.”

Bill Simmons going this route in a podcast interview doesn’t surprise me: his audience is obviously much broader than the geeks in the room, and Simmons knows his audience’s expectations better than anyone. What got to me was James’s willingness to play along, and everyone else’s willingness to eat it up. Here’s an example of both, from the conference’s official Twitter account:

Perhaps it’s because I never really liked baseball, and I didn’t really know anyone did any of this stuff until recently, but I’m pretty certain that Bill James had virtually zero impact on my own development as a sports data-cruncher.  When I made my first PRABS-style basketball formula in the early 1990’s (which was absolutely terrible, but is still more predictive than PER), I had no idea that any sports stats other than the box score even existed. By the time I first heard the word “sabermetrics,” I was deep into my own research, and didn’t bother really looking into it deeply until maybe a few months ago.

Which is not to say I had no guidance or inspiration.  For me, a big epiphanous turning point in my approach to the analysis of games did take place—after I read David Sklansky’s Theory of Poker. While ToP itself was published in 1994, Sklansky’s similar offerings date back to the 70s, so I don’t think any broader causal pictures are possible.

More broadly, I think the claim that sports analytics wouldn’t have developed without Bill James is preposterous. Especially if, as i assume we do, we firmly believe we’re right.  This isn’t like L. Ron Hubbard and Incident II: being for sports analytics isn’t like having faith in a person or his religion. It simply means trying to think more rigorously about sports, and using all of the available analytical techniques we can to gain an advantage. Eventually, those who embrace the right will win out, as we’ve seen begin to happen in sports, and as has already happened in nearly every other discipline.

Indeed, by his own admission, James liked to stir controversy, piss people off, and talk down to the old guard whenever possible. As far as we know, he may have set the cause of sports analytics back, either by alienating the people who could have helped it gain acceptance, or by setting an arrogant and confrontational tone for his disciples (e.g., the uplifting “don’t feel the need to explain yourself” message in Moneyball). I’m not saying that this is the case or even a likely possibility, I’m just trying to illustrate that giving someone credit for all that follows—even a pioneer like James—is a dicey game that I’d rather not participate in, and that he definitely shouldn’t.

On a more technical note, one of his oft-quoted and re-tweeted pearls of wisdom goes as follows:

Sounds great, right? I mean, not really, I don’t get the metaphor: if the sea is full of ignorance, why are you collecting water from it with a bucket rather than some kind of filtration system? But more importantly, his argument in defense of this claim is amazingly weak. When Simmons asked what kinds of things he’s talking about, he repeatedly emphasized that we have no idea whether a college sophomore will turn out to be a great Major League pitcher.  True, but, um, we never will. There are too many variables, the input and outputs are too far apart in time, and the contexts are too different.  This isn’t the sea of ignorance, it’s a sea of unknowns.

Which gets at one of my big complaints about stats-types generally.  A lot of people seem to think that stats are all about making exciting discoveries and answering questions that were previously unanswerable. Yes, sometimes you get lucky and uncover some relationship that leads to a killer new strategy or to some game-altering new dynamic. But most of the time, you’ll find static. A good statistical thinker doesn’t try to reject the static, but tries to understand it: Figuring out what you can’t know is just as important as figuring out what you can know.

On Twitter I used this analogy:

Success comes with knowing more true things and fewer false things than the other guy.

Graph of the Day: NBA Player Stats v. Team Differentials (Follow-Up)

In this post from my Rodman series, I speculated that “individual TRB% probably has a more causative effect on team TRB% than individual PPG does on team PPG.”  Now, using player/team differential statistics (first deployed in my last Rodman post), I think I can finally test this hypothesis:

image

Note: As before, this dataset includes all regular season NBA games from 1986-2010.  For each player who both played and missed at least 20 games in the same season (and averaged at least 20 minutes per game played), differentials are calculated for each team stat with the player in and out of the lineup, weighted by the smaller of games played or games missed that season.  The filtered data includes 1341 seasons and a total of 39,162 weighted games.

This graph compares individual player statistics to his in/out differential for each corresponding team statistic.  For example, a player’s points per game is correlated to his team’s points per game with him in the lineup minus their points per game with him out of the lineup.  Unlike direct correlations to team statistics, this technique tells us how much a player’s performance for a given metric actually causes his team to be better at the thing that metric measures.

Lower values on this scale can potentially indicate a number of things, particularly two of my favorites: duplicability (stat reflects player “contributions” that could have happened anyway—likely what’s going on with Defensive Rebounding %), and/or entanglement (stat is caused by team performance more than it contributes to team performance—likely what’s going on with Assist %).

In any case, the data definitely appears to support my hypothesis: Player TRB% does seem to have a stronger causative effect on team TRB% than player PPG does on team PPG.

The Case for Dennis Rodman, Part 2/4 (a)(i)—Player Valuation and Conventional Wisdom

Dennis Rodman is a – perhaps the – classic hard case for serious basketball valuation analysis.  The more you study him, the more you are forced to engage in meta-analysis: that is, examining the advantages and limitations of the various tools in the collective analytical repertoire.  Indeed, it’s even more than a hard case, it’s an extremely important one: it is just these conspicuously difficult situations where reliable analytical insight could be most useful, yet depending on which metric you choose, Rodman is either a below-average NBA player or one of the greatest of all time.  Moreover, while Rodman may be an “extreme” of sorts, this isn’t Newtonian Physics: the problems with player valuation modeling that his case helps reveal – in both conventional and unconventional forms – apply very broadly.

This section will use Dennis Rodman as a case study for my broader critique of both conventional and unconventional player valuation methods.  Sub-section (i) introduces my criticism and deals with conventional wisdom, and sub-section (ii) deals with unconventional wisdom and beyond.  Section (b) will then examine how valuable Rodman was specifically, and why.  Background here, here, here, here, and here.

First – A Quick Meta-Critique:

Why is it that so many sports-fans pooh-pooh advanced statistical analysis, yet, when making their own arguments, spout nothing but statistics?

  • [So-and-so] scored 25 points per game last season, solidifying their position in the NBA elite.
  • [Random QB] had ten 3000-yard passing seasons, he is sooo underrated.
  • [Player x]’s batting average is down 50 points, [team y] should trade him while they still can.

Indeed, the vast majority of people are virtually incapable of making sports arguments that aren’t stats-based in one way or another.  Whether he knows it or not, Joe Average is constantly learning and refining his preferred models, which he then applies to various problems, for a variety of purposes — not entirely unlike Joe Academic.  Yet chances are he remains skeptical of the crazy-talk he hears from the so-called “statistical experts” — and there is truth to this skepticism: a typical “fan” model is extremely flexible, takes many more variables from much more diverse data into account, and ultimately employs a very powerful neural network to arrive at its conclusions.  Conversely, the “advanced” models are generally rigid, naïve, over-reaching, hubristic, prove much less than their creators believe, and claim even more.  Models are to academics like screenplays are to Hollywood waiters: everyone has one, everyone thinks theirs is the best, and most of them are garbage.  The broad reliability of “common sense” over time has earned it the benefit of the doubt, despite its high susceptibility to bias and its abundance of easily-provable errors.

The key is this: While finding and demonstrating such error is easy enough, successfully doing so should not – as it so often does – lead one (or even many) to presume that it qualifies them to replace that wisdom, in its entirety, with their own.

I believe something like this happened in the basketball analytic community:  reacting to the manifest error in conventional player valuation, the statisticians have failed to recognize the main problem – one which I will show actually limits their usefulness – and instead have developed an “unconventional” wisdom that ultimately makes many of the same mistakes.

Conventional Wisdom – Points, Points, Points:

The standard line among sports writers and commentators today is that Dennis Rodman’s accomplishments “on the court” would easily be sufficient to land him in the Hall of Fame, but that his antics “off the court” may give the voters pause.  This may itself be true, but it is only half the story:  If, in addition to his other accomplishments, Rodman had scored 15 points a game, I don’t think we’d be having this discussion, or really even close to having this discussion (note, this would be true whether or not those 15 points actually helped his teams in any way).  This is because the Hall of Fame reflects the long-standing conventional wisdom about player valuation: that points (especially per game) are the most important measure of a player’s (per game) contribution.
Whether most people would explicitly endorse this proposition or not, it is still reflected in systematic bias.  The story goes something like this:  People watch games to see the players do cool things, like throw a ball from a long distance through a tiny hoop, and experience pleasure when it happens.  Thus, because pleasure is good, they begin to believe that those players must be the best players, which is then reinforced by media coverage that focuses on point totals, best dunks plays of the night, scoring streaks, scoring records, etc.  This emphasis makes them think these must also be the most important players, and when they learn about statistics, that’s where they devote their attention.  Everyone knows about Kobe’s 81 points in a game, but how many people know about Scott Skiles’s 30 assists? or Charles Oakley’s 35 rebounds? or Rodman’s 18 offensive boards? or Shaq’s 15 blocks?  Many fans even know that Mark Price is the all-time leader in free throw percentage, or that Steve Kerr is the all-time leader in 3 point percentage, but most have never even heard of rebound percentage, much less assist percentage or block percentage.  And, yes, for those who vote for the Hall of Fame, it is also reflected in their choices.  Thus, before dealing with any fall-out for his off-court “antics,” the much bigger hurdle to Dennis Rodman’s induction looks like this:

image

This list is the bottom-10 per-game scorers (of players inducted within 25 years of their retirement).  If Rodman were inducted, he would be the single lowest point-scorer in HoF history.  And looking at the bigger picture, it may even be worse than that.  Here’s a visual of all 89 Hall of Famers with stats (regardless of induction time), sorted from most points to fewest:

image

So not only would he be the lowest point scorer, he would actually have significantly fewer points than a (linear) trend-line would predict the lowest point scorer to have (and most of the smaller bars just to the left of Rodman were Veteran’s Committee selections).  Thus, if historical trends reflect the current mood of the HoF electorate, resistance is to be expected.

The flip-side, of course, is the following:

imageNote: this graphic only contains the players for whom this stat is available, though, as I demonstrated previously, there is no reason to believe that earlier players were any better.
Clearly, my first thought when looking at this data was, “Who the hell is this guy with a TRB% of only 3.4?”  That’s only 1 out of every *30* rebounds!* The league average is (obviously) 1 out of 10.  Muggsy Bogues — the shortest player in the history of the NBA (5’3”) — managed to pull in 5.1%, about 1 out of every 20.  On the other side, of course, Rodman would pace the field by a wide margin – wider, even, than the gap between Jordan/Chamberlain and the field for scoring (above).  Of course, the Hall of Fame traditionally doesn’t care that much about rebounding percentages:

image

So, of eligible players, 24 of the top 25 leaders in points per game are presently in the Hall (including the top 19 overall), while only 9 of the top 25 leaders in total rebound percentage can say the same.  This would be perfectly rational if, say, PPG was way way more important to winning than TRB%.  But this seems unlikely to me, for at least two reasons: 1) As a rate stat, TRB% shouldn’t be affected significantly by game or team pace, as PPG is; and 2) TRB% has consequences on both offense and defense, whereas PPG is silent about the number of points the player/team has given up.  To examine this question, I set up a basic correlation of team stats to team winning percentage for the set of every team season since the introduction of the 3-point shot.  Lo and behold, it’s not really close:

image

Yes, correlation does not equal causation, and team scoring and rebounding are not the same as individual scoring and rebounding.  This test isn’t meant to prove conclusively that rebounding is more important than scoring, or even gross scoring — though, at the very least, I do think it strongly undermines the necessity of the opposite: that is, the assumption that excellence in gross point-scoring is indisputably more significant than other statistical accomplishments.
Though I don’t presently have the data to confirm, I would hypothesize (or, less charitably, guess) that individual TRB% probably has a more causative effect on team TRB% than individual PPG does on team PPG [see addendum] (note, to avoid any possible misunderstanding, I mean this only w/r/t PPG, not points-per-possession, or anything having to do with shooting percentages, true or otherwise).  Even with the proper data, this could be a fairly difficult hypothesis to test, since it can be hard to tell (directly) whether a player scoring a lot of points causes his team to score a lot of points, or vice versa.  However, that hypothesis seems to be at least partially supported by studies that others have conducted on rebound rates – especially on the offensive side (where Rodman obviously excelled).

The conventional wisdom regarding the importance of gross points is demonstrably flawed on at least two counts: gross, and points.  In sub-section (ii), I will look at how the analytical community attempted to deal with these problems, as well as at how they repeated them.
*(It’s Tiny Archibald)


Addendum (4/20/11):

I posted this as a Graph of the Day a while back, and thought I should add it here:
image

More info in the original post, but the upshot is that my hypothesis that “individual TRB% probably has a more causative effect on team TRB% than individual PPG does on team PPG” appears to be confirmed (the key word is “differential”).

The Case for Dennis Rodman, Part 1/4 (c)—Rodman v. Ancient History

One of the great false myths in basketball lore is that Wilt Chamberlain and Bill Russell were Rebounding Gods who will never be equaled, and that dominant rebounders like Dennis Rodman should count their blessings that they got to play in a era without those two deities on the court.  This myth is so pervasive that it is almost universally referenced as a devastating caveat whenever sports commentators and columnists discuss Rodman’s rebounding prowess.  In this section, I will attempt to put that caveat to death forever.

The less informed version of the “Chamberlain/Russell Caveat” (CRC for short) typically goes something like this: “Rodman led the league in rebounding 7 times, making him the greatest re bounder of his era, even though his numbers come nowhere near those of Chamberlain and Russell.”  It is true that, barring some dramatic change in the way the game is played, Chamberlain’s record of 27.2 rebounds per game, set in the 1960-61 season, will stand forever.  This is because, due to the fast pace and terrible shooting, the typical game in 1960-61 featured an average of 147 rebounding opportunities.  During Rodman’s 7-year reign as NBA rebounding champion (from 1991-92 through 1997-98), the typical game featured just 84 rebounding opportunities.  Without further inquiry, this difference alone means that Chamberlain’s record 27.2 rpg would roughly translate to 15.4 in Rodman’s era – over a full rebound less than Rodman’s ~16.7 rpg average over that span.

The slightly more informed (though equally wrong) version of the CRC is a plea of ignorance, like so: “Rodman has the top 7 rebounding percentages since the NBA started to keep the necessary statistics in 1970.  Unfortunately, there is no game-by-game or individual opponent data prior to this, so it is impossible to tell whether Rodman was as good as Russell or Chamberlain” (this point also comes in many degrees of snarky, like, “I’ll bet Bill and Wilt would have something to say about that!!!”).  We may not have the necessary data to calculate Russell and Chamberlain’s rebounding rates, either directly or indirectly.  But, as I will demonstrate, there are quite simple and extremely accurate ways to estimate these figures within very tight ranges (which happen to come nowhere close to Dennis Rodman).

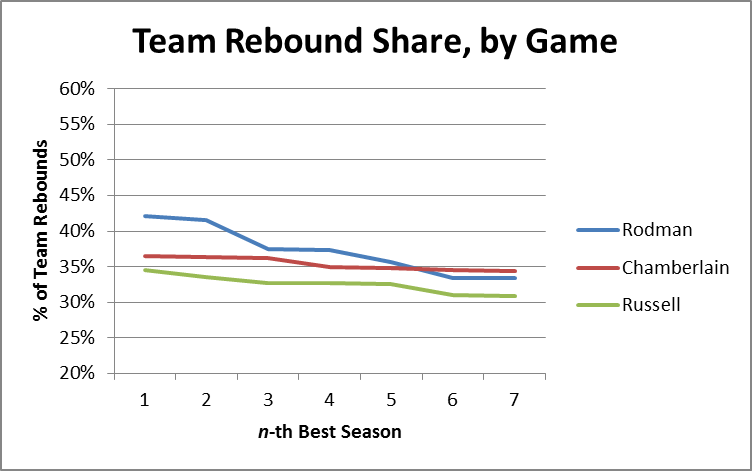
Before getting into rebounding percentages, however, let’s start with another way of comparing overall rebounding performance: Team Rebound Shares.  Simply put, this metric is the percentage of team rebounds that were gotten by the player in question.  This can be done for whole seasons, or it can be approximated over smaller periods, such as per-game or per-minute, even if you don’t have game-by-game data.  For example, to roughly calculate the stat on a per-game basis, you can simply take a player’s total share of rebounds (their total rebounds/team’s total rebounds), and divide by the percentage of games they played (player gms/team gms).  I’ve done this for all of Rodman, Russell and Chamberlain’s seasons, and organized the results as follows:

Wilt and Bill_28675_image001

As we can see, Rodman does reasonably well in this metric, still holding the top 4 seasons and having a better average through 7.  This itself is impressive, considering Rodman averaged about 35 minutes per game and Wilt frequently averaged close to 48.

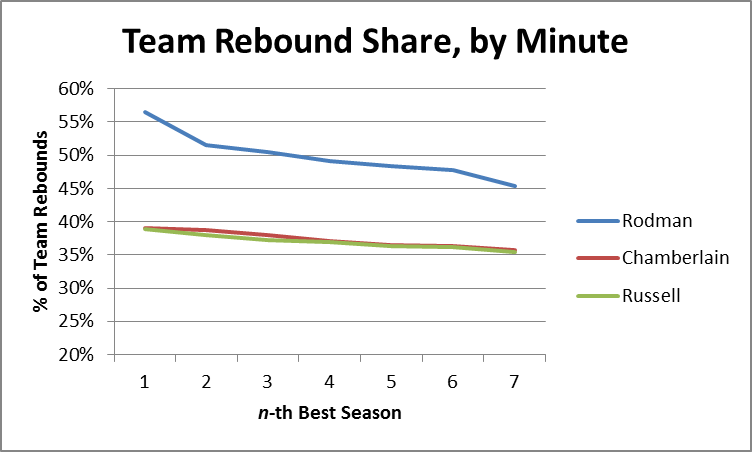
I should note, in Chamberlain’s favor, that one of the problems I have with PER and its relatives is that they don’t give enough credit for being able to contribute extra minutes, as Wilt obviously could.  However, since here I’m interested more in each player’s rebounding ability than in their overall value, I will use the same equation as above (plus dividing by 5, corresponding to the maximum minutes for each player) to break the team rebounding shares down by minute:

Wilt and Bill_28675_image002

This is obviously where Rodman separates himself from the field, even pulling in >50% of his team’s rebounds in 3 different seasons.  Of course, this only tells us what it tells us, and we’re looking for something else: Total Rebounding percentage.  Thus, the question naturally arises: how predictive of TRB% are “minute-based team rebound shares”?

In order to answer this question, I created a slightly larger data-set, by compiling relevant full-season statistics from the careers of Dennis Rodman, Dwight Howard, Tim Duncan, David Robinson, and Hakeem Olajuwon (60 seasons overall).  I picked these names to represent top-level rebounders in a variety of different situations (and though these are somewhat arbitrary, this analysis doesn’t require a large sample).  I then calculated TRS by minute for each season and divided by 2 — roughly corresponding to the player’s share against 10 players instead of 5.  Thus, all combined, my predictive variable is determined as follows:

PV=\frac{Player Rebounds/Team Rebounds}{Player Minutes/Team Minutes}/10

Note that this formula may have flaws as an independent metric, but if it’s predictive enough of the metric we really care about — Total Rebound % — those no longer matter.  To that end, I ran a linear regression in Excel comparing this new variable to the actual values for TRB%, with the following output:

image

If you don’t know how to read this, don’t sweat it.  The “R Square” of .98 pretty much means that our variable is almost perfectly predictive of TRB%.  The two numbers under “Coefficients” tell us the formula we should use to make predictions based on our variable:

Predicted TRB\% = 1.08983*PV - .01154

Putting the two equations together, we have a model that predicts a player’s rebound percentage based on 4 inputs:

TRB\% = 1.08983 * \frac{Player Rebounds/Team Rebounds}{Player Minutes/Team Minutes} /10 - .0115

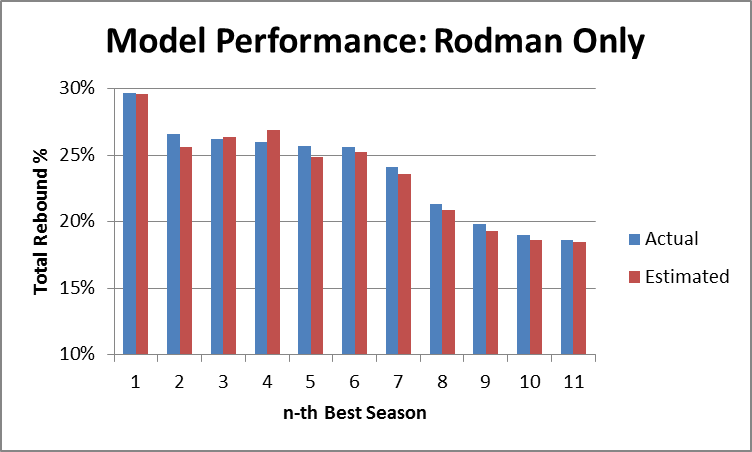
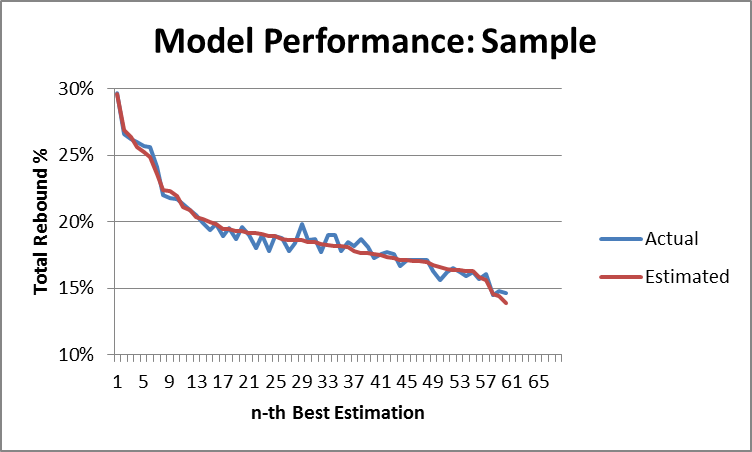
Now again, if you’re familiar with regression output, you can probably already see that this model is extremely accurate.  But to demonstrate that fact, I’ve created two graphs that compare the predicted values with actual values, first for Dennis Rodman alone:

Wilt and Bill_28675_image005

And then for the full sample:

Wilt and Bill_28675_image007

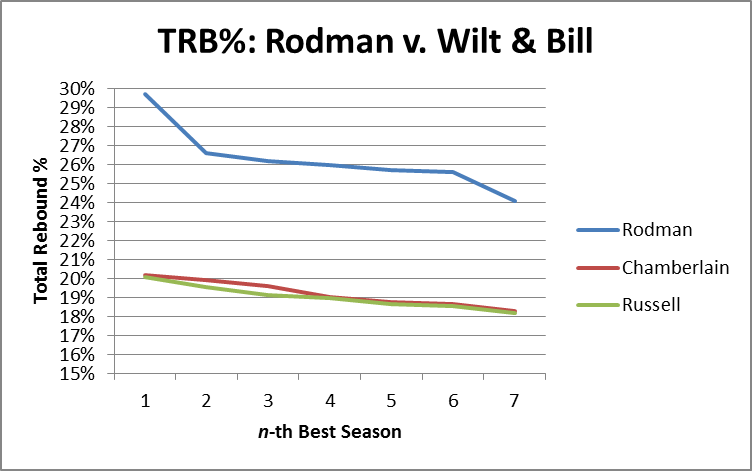
So, the model seems solid.  The next step is obviously to calculate the predicted total rebound percentages for each of Wilt Chamberlain and Bill Russell’s seasons.  After this, I selected the top 7 seasons for each of the three players and put them on one graph (Chamberlain and Russell’s estimates vs. Rodman’s actuals):

Wilt and Bill_28675_image009

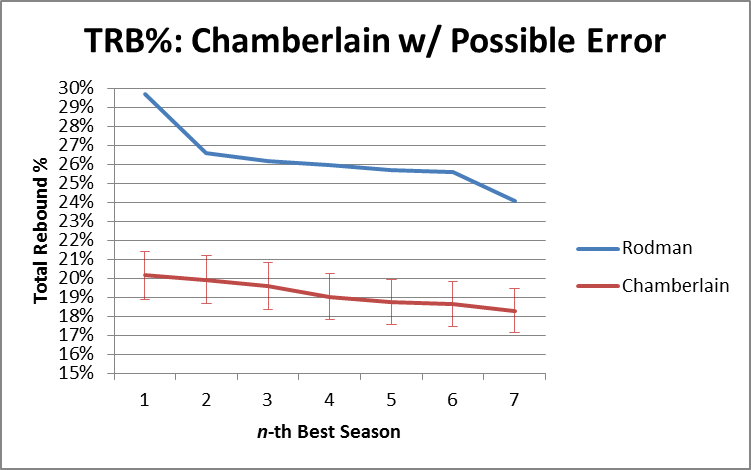
It’s not even close.  It’s so not close, in fact, that our model could be way off and it still wouldn’t be close.  For the next two graphs, I’ve added error bars to the estimation lines that are equal to the single worst prediction from our entire sample (which was a 1.21% error, or 6.4% of the underlying number):  [I should add a technical note, that the actual expected error should be slightly higher when applied to “outside” situations, since the coefficients for this model were “extracted” from the same data that I tested the model on.  Fortunately, that degree of precision is not necessary for our purposes here.]  First Rodman vs. Chamberlain:

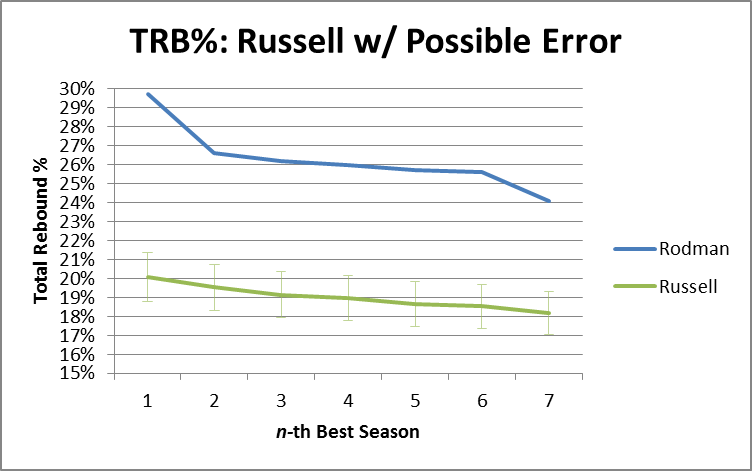
Then Rodman vs. Russell:

In other words, if the model were as inaccurate in Russell and Chamberlain’s favor as it was for the worst data point in our data set, they would still be crushed.  In fact, over these top 7 seasons, Rodman beats R&C by an average of 7.2%, so if the model understated their actual TRB% every season by 5 times as much as the largest single-season understatement in our sample, Rodman would still be ahead [edit: I’ve just noticed that Pro Basketball Reference has a TRB% listed for each of Chamberlain’s last 3 seasons.  FWIW, this model under-predicts one by about 1%, over-predicts one by about 1%, and gets the third almost on the money (off by .1%)].

To stick one last dagger in CRC’s heart, I should note that this model predicts that Chamberlain’s best TRB% season would have been around 20.16%, which would rank 67th on the all-time list.  Russell’s best of 20.08 would rank 72nd.  Arbitrarily giving them 2% for the benefit of the doubt, their best seasons would still rank 22nd and 24th respectively.

The Case for Dennis Rodman, Part 1/4 (b)—Defying the Laws of Nature

In this post I will be continuing my analysis of just how dominant Dennis Rodman’s rebounding was.  Subsequently, section (c) will cover my analysis of Wilt Chamberlain and Bill Russell, and Part 2 of the series will begin the process of evaluating Rodman’s worth overall.

For today’s analysis, I will be examining a particularly remarkable aspect of Rodman’s rebounding: his ability to dominate the boards on both ends of the court.  I believe this at least partially gets at a common anti-Rodman argument: that his rebounding statistics should be discounted because he concentrated on rebounding to the exclusion of all else.  This position was publicly articulated by Charles Barkley back when they were both still playing, with Charles claiming that he could also get 18+ rebounds every night if he wanted to.  Now that may be true, and it’s possible that Rodman would have been an even better player if he had been more well-rounded, but one thing I am fairly certain of is that Barkley could not have gotten as many rebounds as Rodman the same way that Rodman did.

The key point here is that, normally, you can be a great offensive rebounder, or you can be a great defensive rebounder, but it’s very hard to be both.  Unless you’re Dennis Rodman:

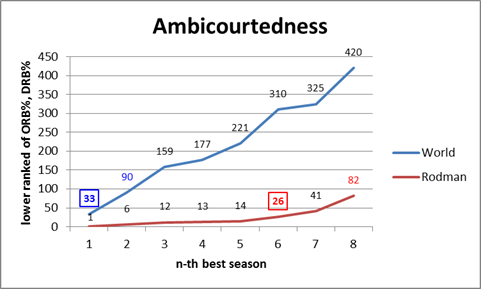
To prepare the data for this graph, I took the top 1000 rebounding seasons by total rebounding percentage (the gold-standard of rebounding statistics, as discussed in section (a)), and ranked them 1-1000 for both offensive (ORB%) and defensive (DRB%) rates.  I then scored each season by the higher (larger number) ranking of the two.  E.g., if a particular season scored a 25, that would mean that it ranks in the top 25 all-time for offensive rebounding percentage and in the top 25 all-time for defensive rebounding percentage (I should note that many players who didn’t make the top 1000 seasons overall would still make the top 1000 for one of the two components, so to be specific, these are the top 1000 ORB% and DRB% seasons of the top 1000 TRB% seasons).

This score doesn’t necessarily tell us who the best rebounder was, or even who was the most balanced, but it should tell us who was the strongest in the weakest half of their game (just as you might rank the off-hand of boxers or arm wrestlers).  Fortunately, however, Rodman doesn’t leave much room for doubt:  his 1994-1995 season is #1 all-time on both sides.  He has 5 seasons that are dual top-15, while no other NBA player has even a single season that ranks dual top-30.  The graph thus shows how far down you have to go to find any player with n number of seasons at or below that ranking: Rodman has 6 seasons register on the (jokingly titled) “Ambicourtedness” scale before any other player has 1, and 8 seasons before any player has 2 (for the record, Charles Barkley’s best rating is 215).

This outcome is fairly impressive alone, and it tells us that Rodman was amazingly good at both ORB and DRB – and that this is rare — but it doesn’t tell us anything about the relationship between the two.  For example, if Rodman just got twice as many rebounds as any normal player, we would expect him to lead lists like this regardless of how he did it.  Thus, if you believe the hypothesis that Rodman could have dramatically increased his rebounding performance just by focusing intently on rebounds, this result might not be unexpected to you.

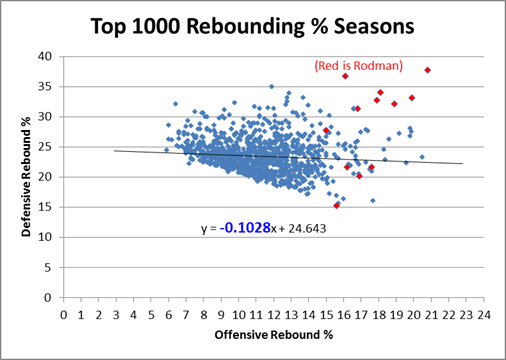
The problem, though, is that there are both competitive and physical limitations to how much someone can really excel at both simultaneously. Not the least of which is that offensive and defensive rebounds literally take place on opposite sides of the floor, and not everyone gets up and set for every possession.  Thus, if someone wanted to cheat toward getting more rebounds on the offensive end, it would likely come, at least in some small part, at the expense of rebounds on the defensive end.  Similarly, if someone’s playing style favors one, it probably (at least slightly), disfavors the other.  Whether or not that particular factor is in play, at the very least you should expect a fairly strong regression to the mean: thus, if a player is excellent at one or the other, you should expect them to be not as good at the other, just as a result of the two not being perfectly correlated.  To examine this empirically, I’ve put all 1000 top TRB% seasons on a scatterplot comparing offensive and defensive rebound rates:

Clearly there is a small negative correlation, as evidenced by the negative coefficient in the regression line.  Note that technically, this shouldn’t be a linear relationship overall – if we graphed every pair in history from 0,0 to D,R, my graph’s trendline would be parallel to the tangent of that curve as it approaches Dennis Rodman.  But what’s even more stunning is the following:

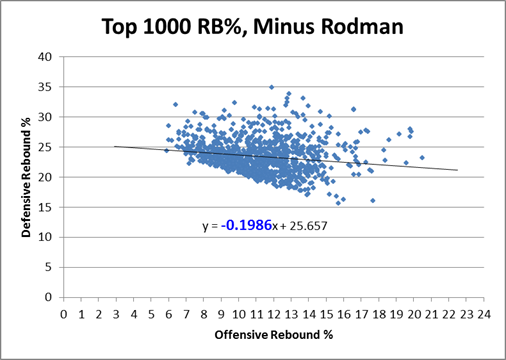
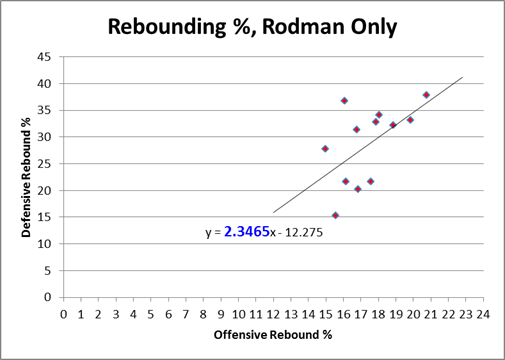
Rodman is in fact not only an outlier, he is such a ridiculously absurd alien-invader outlier that when you take him out of the equation, the equation changes drastically:  The negative slope of the regression line nearly doubles in Rodman’s absence.  In case you’ve forgotten, let me remind you that Rodman only accounts for 12 data points in this 1000 point sample: If that doesn’t make your jaw drop, I don’t know what will!  For whatever reason, Rodman seems to be supernaturally impervious to the trade-off between offensive and defensive rebounding.  Indeed, if we look at the same graph with only Rodman’s data points, we see that, for him, there is actually an extremely steep, upward sloping relationship between the two variables:

In layman’s terms, what this means is that Rodman comes in varieties of Good, Better, and Best — which is how we would expect this type of chart to look if there were no trade-off at all.  Yet clearly the chart above proves that such a tradeoff exists!  Dennis Rodman almost literally defies the laws of nature (or at least the laws of probability).

The ultimate point contra Barkley, et al, is that if Rodman “cheated” toward getting more rebounds all the time, we might expect that his chart would be higher than everyone else’s, but we wouldn’t have any particular reason to expect it to slope in the opposite direction.  Now, this is slightly more plausible if he was “cheating” on the offensive side on the floor while maintaining a more balanced game on the defensive side, and there are any number of other logical speculations to be made about how he did it.  But to some extent this transcends the normal “shift in degree” v. “shift in kind” paradigm:  what we have here is a major shift in degree of a shift in kind, and we don’t have to understand it perfectly to know that it is otherworldly.  At the very least, I feel confident in saying that if Charles Barkley or anyone else really believes they could replicate Rodman’s results simply by changing their playing styles, they are extremely naive.


Addendum (4/20/11):

Commenter AudacityOfHoops asks:

I don’t know if this is covered in later post (working my way through the series – excellent so far), or whether you’ll even find the comment since it’s 8 months late, but … did you create that same last chart, but for other players? Intuitively, it seems like individual players could each come in Good/Better/Best models, with positive slopes, but that when combined together the whole data set could have a negative slope.

I actually addressed this in an update post (not in the Rodman series) a while back:

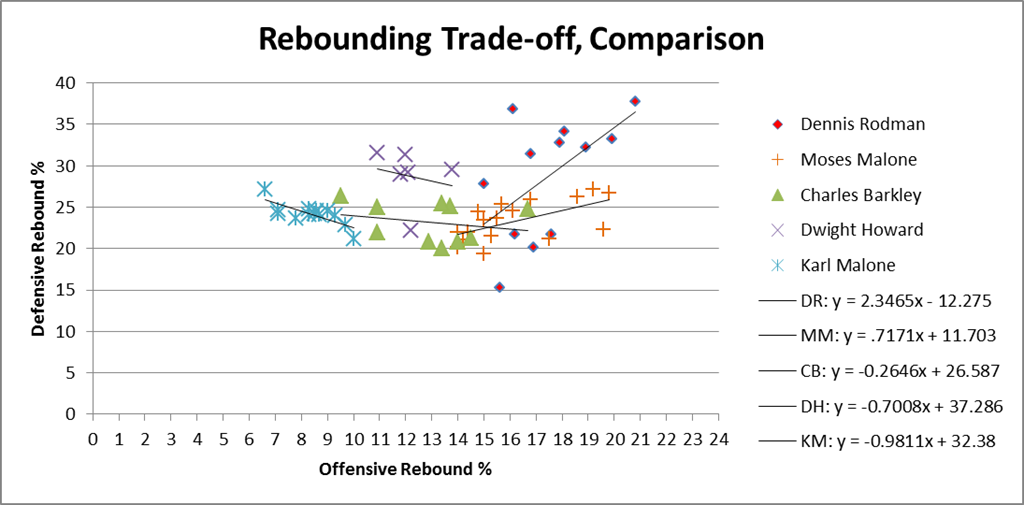
A friend privately asked me what other NBA stars’ Offensive v. Defensive rebound % graphs looked like, suggesting that, while there may be a tradeoff overall, that doesn’t necessarily mean that the particular lack of tradeoff that Rodman shows is rare. This is a very good question, so I looked at similar graphs for virtually every player who had 5 or more seasons in the “Ambicourtedness Top 1000.” There are other players who have positively sloping trend-lines, though none that come close to Rodman’s. I put together a quick graph to compare Rodman to a number of other big name players who were either great rebounders (e.g., Moses Malone), perceived-great rebounders (e.g., Karl Malone, Dwight Howard), or Charles Barkley:

Top 1000_11343_image001

By my accounting, Moses Malone is almost certainly the 2nd-best rebounder of all time, and he does show a healthy dose of “ambicourtedness.” Yet note that the slope of his trendline is .717, meaning the difference between him and Rodman’s 2.346 is almost exactly twice the difference between him and the -.102 league average (1.629 v .819).