In their win over Detroit on Sunday, Green Bay once again managed to emerge victorious despite giving up more yards than they gained. This is practically old hat for them, as it’s the 10th time that they’ve done it this year. Over the course of the season, the 15-1 Packers gave up a stunning 6585 yards, while gaining “just” 6482—thus losing the yardage battle despite being the league’s most dominant team.
This anomaly certainly captures the imagination, and I’ve received multiple requests for comment. E.g., a friend from my old poker game emails:
Just heard that the Packers have given up more yards than they’ve gained and was wondering how to explain this. Obviously the Packers’ defense is going to be underrated by Yards Per Game metrics since they get big leads and score quickly yada yada, but I don’t see how this has anything to do with the fact they’re being outgained. I assume they get better starting field position by a significant amount relative to their opponents so they can have more scoring drives than their opponents while still giving up more yards than they gain, but is that backed up by the stats?
Last week Advanced NFL Stats posted a link to this article from Smart Football looking into the issue in a bit more depth. That author does a good job examining what this stat means, and whether or not it implies that Green Bay isn’t as good as they seem (he more or less concludes that it doesn’t).
But that doesn’t really answer the question of how the anomaly is even possible, much less how or why it came to be. With that in mind, I set out to solve the problem. Unfortunately, after having looked at the issue from a number of angles, and having let it marinate in my head for a week, I simply haven’t found an answer that I find satisfying. But, what the hell, one of my resolutions is to pull the trigger on this sort of thing, so I figure I should post what I’ve got.
How Anomalous?
The first thing to do when you come across something that seems “crazy on its face” is to investigate how crazy it actually is (frequently the best explanation for something unusual is that it needs no explanation). In this case, however, I think the Packers’ yardage anomaly is, indeed, “pretty crazy.” Not otherworldly crazy, but, say, on a scale of 1 to “Kurt Warner being the 2000 MVP,” it’s at least a 6.
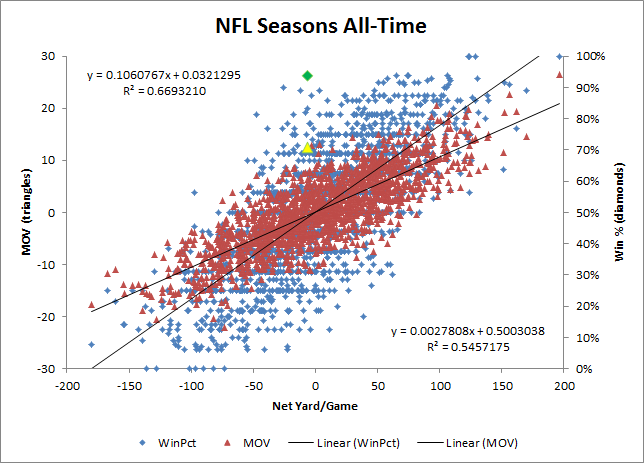
First, I was surprised to discover that just last year, the New England Patriots also had the league’s best record (14-2), and also managed to lose the yardage battle. But despite such a recent example of a similar anomaly, it is still statistically pretty extreme. Here’s a plot of more or less every NFL team season from 1936 through the present, excluding seasons where the relevant stats weren’t available or were too incomplete to be useful (N=1647):
The green diamond is the Packers net yardage vs. Win%, and the yellow triangle is their net yardage vs. Margin of Victory (net points). While not exactly Rodman-esque outliers, these do turn out to be very historically unusual:
Win %
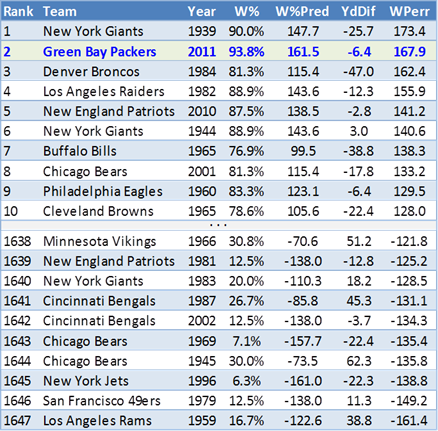
Using the trendline equation on the graph above (plus basic algebra), we can use a team’s season Win percentage to calculate their expected yardage differential. With that prediction in hand, we can compare how much each team over or under-performed its “expectation”:
Both the 2011 Packers and the 2010 Patriots are in the top 5 all-time, and I should note that the 1939 New York Giants disparity is slightly overstated, because I excluded tie games entirely (ties cause problems elsewhere b/c of perfect correlation with MOV).
Margin of Victory
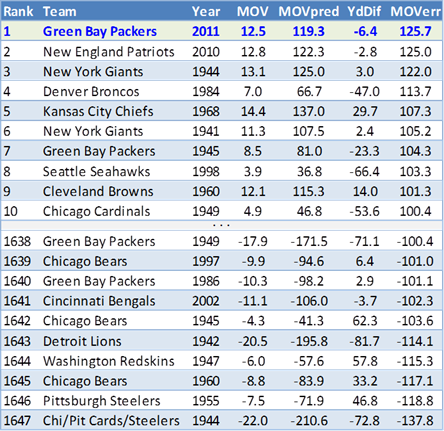
Toward the conclusion of that Smart Football article, the author notes that Green Bay’s Margin of Victory isn’t as strong as their overall record, noting that the Packers “Pythagorian Record” (expectation computed from points scored and points allowed) is more like 11-5 or 12-4 than 15-1 (note that getting from extremely high Win % to very high MOV is incidental: 15-win teams are usually 11 or 12 win teams that have experienced good fortune). Green Bay’s MOV of 12.5 is a bit lower than the historical average for 15-1 teams (13.8) but don’t let this mislead you: the disparity between the yardage differential that we would expect based on Green Bay’s MOV and their actual result (using a linear projection, as above) is every bit as extreme as what we saw from Win %:
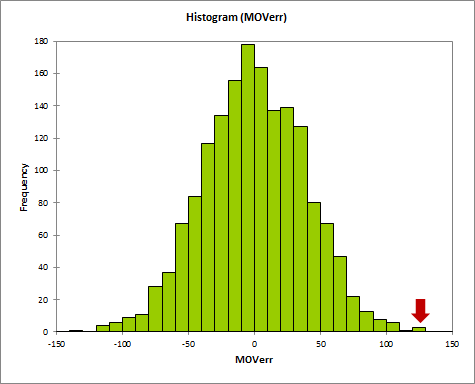
And here, in histogram form:
So, while not the most unusual thing to ever happen in sports, this anomaly is certainly unusual enough to look into.
For the record, the Packers’ MOV -> yard diff error is 3.23 standard deviations above the mean, while the Win% -> yard diff is 3.28. But since MOV correlates more strongly with the target stat (note an average error of only 125 yards instead of 170), a similar degree of abnormality leaves it as the more stable and useful metric to look at.
Thus, the problem can be framed as follows: The 2011 Packers fell around 2000 yards (the 125.7 above * 16 games) short of their expected yardage differential. Where did that 2000 yard gap come from?
Possible Factors and/or Explanations
Before getting started, I should note that, out of necessity, some of these “explanations” are more descriptive than actually explanatory, and even the ones that seem plausible and significant are hopelessly mixed up with one another. At the end of the day, I think the question of “What happened?” is addressable, though still somewhat unclear. The question of “Why did it happen?” remains largely a mystery: The most substantial claim that I’m willing to make with any confidence is that none of the obvious possibilities are sufficient explanations by themselves.
While I’m somewhat disappointed with this outcome, it makes sense in a kind of Fermi Paradox, “Why Aren’t They Here Yet?” kind of way. I.e., if any of the straightforward explanations (e.g., that their stats were skewed by turnovers or “garbage time” distortions) could actually create an anomaly of this magnitude, we’d expect it to have happened more often.
And indeed, the data is actually consistent with a number of different factors (granted, with significant overlap) being present at once.
Line of Scrimmage, and Friends
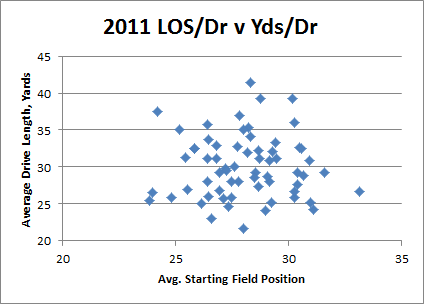
As suggested in the email above, one theoretical explanation for the anomaly could be the Packers’ presumably superior field position advantage. I.e., with their offense facing comparatively shorter fields than their opponents, they could have literally had fewer yards available to gain. This is an interesting idea, but it turns out to be kind of a bust.
The Packers did enjoy a reciprocal field position advantage of about 5 yards. But, unfortunately, there doesn’t seem to be a noticeable relationship between average starting field position and average yards gained per drive (which would have to be true ex ante for this “explanation” to have any meaning):
Note: Data is from the Football Outsiders drive stats.
This graph plots both offenses and defenses from 2011. I didn’t look at more historical data, but it’s not really necessary: Even if a larger dataset revealed a statistically significant relationship, the large error rate (which converges quickly) means that it couldn’t alter expectation in an individual case by more than a fraction of a yard or so per possession. Since Green Bay only traded 175ish possessions this season, it couldn’t even make a dent in our 2000 missing yards (again, that’s if it existed at all).
On the other hand, one thing in the F.O. drive stats that almost certainly IS a factor, is that the Packers had a net of 10 fewer possessions this season than their opponents. As Green Bay averaged 39.5 yards per possession, this difference alone could account for around 400 yards, or about 20% of what we’re looking for.
Moreover, 5 of those 10 possessions come from a disparity in “zero yard touchdowns,” or net touchdowns scored by their defense and special teams: The Packers scored 7 of these (5 from turnovers, 2 from returns) while only allowing 2 (one fumble recovery and one punt return). Such scores widen a team’s MOV without affecting their total yardage gap.
[Warning: this next point is a bit abstract, so feel free to skip to the end.] Logically, however, this doesn’t quite get us where we want to go. The relevant question is “What would the yardage differential have been if the Packers had the same number of possessions as their opponents?” Some percentage of our 10 counterfactual drives would result in touchdowns regardless. Now, the Packers scored touchdowns on 37% of their actual drives, but scored touchdowns on at least 50% of their counterfactual drives (the ones that we can actually account for via the “zero yard touchdown” differential). Since touchdown drives are, on average, longer than non-touchdown drives, this means that the ~400 yards that can be attributed to the possession gap is at least somewhat understated.
Garbage Time
When considering this issue, probably the first thing that springs to minds is that the Packers have won a lot of games easily. It seems highly plausible that, having rushed out to so many big leads, the Packers must have played a huge amount of “garbage time,” in which their defense could have given up a lot of “meaningless” yards that had no real consequence other than to confound statisticians.
The proportion of yards on each side of the ball that came after Packers games got out of hand should be empirically checkable—but, unfortunately, I haven’t added 2011 Play-by-Play data to my database yet. That’s okay, though, because there are other ways—perhaps even more interesting ways—to attack the problem.
In fact, it’s pretty much right up my alley: Essentially, what we are looking for here is yet another permutation of “Reverse Clutch” (first discussed in my Rodman series, elaborated in “Tim Tebow and the Taxonomy of Clutch”). Playing soft in garbage time is a great way for a team to “underperform” in statistical proxies for true strength. In football, there are even a number of sound tactical and strategic reasons why you should explicitly sacrifice yards in order to maximize your chances of winning. For example, if you have a late lead, you should be more willing to soften up your defense of non-sideline runs and short passes—even if it means giving up more yards on average than a conventional defense would—since those types of plays hasten the end of the game. And the converse is true on offense: With a late lead, you want to run plays that avoid turnovers and keep the clock moving, even if it means you’ll be more predictable and easier to defend.
So how might we expect this scenario to play out statistically? Recall, by definition, “clutch” and “reverse clutch” look the same in a stat sheet. So what kind of stats—or relationships between stats—normally indicate “clutchness”? As it turns out, Brian Burke at Advanced NFL Stats has two metrics pretty much at the core of everything he does: Expected Points Added, and Win Percentage Added. The first of these (EPA) takes the down and distance before and after each play and uses historical empirical data to model how much that result normally affects a team’s point differential. WPA adds time and score to the equation, and attempts to model the impact each play has on the team’s chances of winning.
A team with “clutch” results—whether by design or by chance—might be expected to perform better in WPA (which ultimately just adds up to their number of wins) than in EPA (which basically measures generic efficiency).
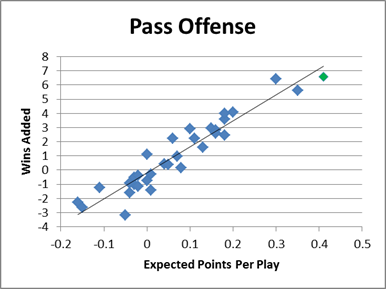
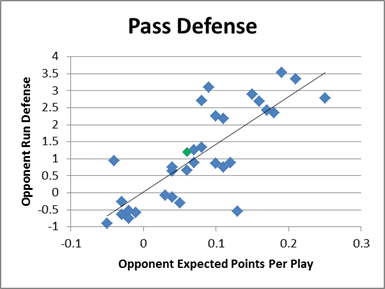
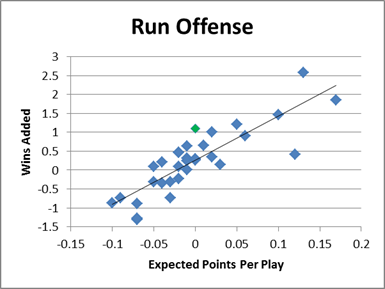
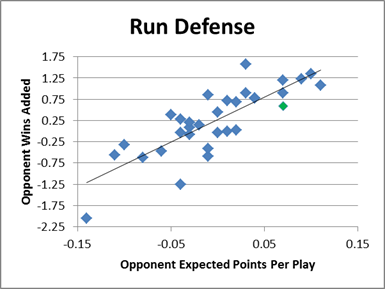
For most aspects of the game, the relationship between these two is strong enough to make such comparisons possible. Here are plots of this comparison for each of the 4 major categories (2011 NFL, Green Bay in green), starting with passing offense (note that the comparison is technically between wins added overall and expected points per play):
Obviously there’s nothing strikingly abnormal about Green Bay’s results in these graphs, but there are small deviations that are perfectly consistent with the garbage time/reverse clutch theory. For the passing game (offense and defense), Green Bay seems to hew pretty close to expectation. But in the rushing game they do have small but noticeable disparities on both sides of the ball. Note that in the scenario I described where a team intentionally trades efficiency for win potential, we would expect the difference to be most acute in the running game (which would be under-defended on defense and overused on offense).
Specifically: Green Bay’s offensive running game has a WPA of 1.1, despite having an EPA per play of zero (which corresponds to a WPA of .25). On defense, the Packers’ EPA/p is .07, which should correspond to an expected WPA of 1.0, while their actual result is .59.
Clearly, both of these effects are small, considering there isn’t a perfect correlation. But before dismissing them entirely, I should note that we don’t immediately know how much of the variation in the graphs above is due to variance for a given team and how much is due to variation between teams. Moreover, without knowing the balance, the fact that both variance and variation contribute to the “entropy” of the observed relationship between EPA/p and WPA, the actual relationship between the two is likely to be stronger than these graphs would make it seem.
The other potential problem is that this comparison is between wins and points, while the broader question is comparing points to yards. But there’s one other statistical angle that helps bridge the two, while supporting the speculated scenario to boot: Green Bay gained 3.9 yards per attempt on offense, and allowed 4.7 yards per attempt on defense—while the league average is 4.3 yards per attempt. So, at least in terms of raw yardage, Green Bay performed “below average” in the running game by about .4 yards/attempt on each side of the ball. Yet, the combined WPA for the Packers running game is positive! Their net rushing WPA is +.5, despite having an expected combined WPA (actually based on their EPA) of -.75.
So, if we thought this wasn’t a statistical artifact, there would be two obvious possible explanations: 1) That Green Bay has a sub-par running game that has happened to be very effective in important spots, or 2) that Green Bay actually has an average (or better) running game that has appeared ineffective (especially as measured by yards gained/allowed) in less important spots. Q.E.D.
For the sake of this analysis, let’s assume that the observed difference for Green Bay here really is a product of strategic adjustments stemming from (or at least related to) their winning ways, how much of our 2000 yard disparity could it account for?
So let’s try a crazy, wildly speculative, back-of-the-envelope calculation: Give Green Bay and its opponents the same number of rushing attempts that they had this season, but with both sides gaining an average number of yards per attempt. The Packers had 395 attempts and their opponents had 383, so at .4 yards each, the yardage differential would swing by 311 yards. So again, interesting and plausibly significant, but doesn’t even come close to explaining our anomaly on its own.
Turnover Effect?
One of the more notable features of the Packers season is their incredible +22 turnover margin. How they managed that and whether it was simply variance or something more meaningful could be its own issue. But in this context, give them the +22, how helpful is that as an explanation for the yardage disparity? Turnovers affect scores and outcomes a ton, but are relatively neutral w/r/t yards, so surely this margin is relevant. But exactly how much does it neutralize the problem?
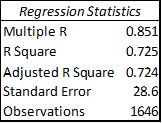
Here, again, we can look at the historical data. To predict yardage differential based on MOV and turnover differential, we can set up an extremely basic linear regression:
The R-Square value of .725 means that this model is pretty accurate (MOV alone achieved around .66). Both variables are extremely significant (from p value, or absolute value of t-stat). Based on these coefficients, the resulting predictive equation is
YardsDiff = 7.84*MOV – 23.3*TOdiff/gm
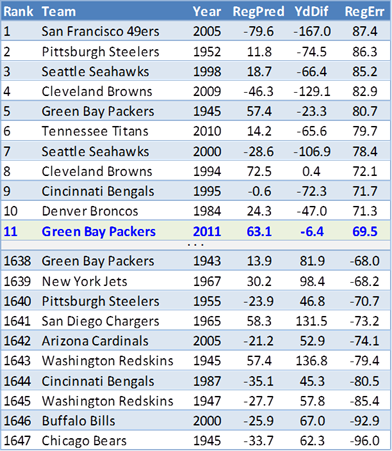
Running the dataset through the same process as above (comparing predictions with actual results and calculating the total error), here’s how the new rankings turns out:
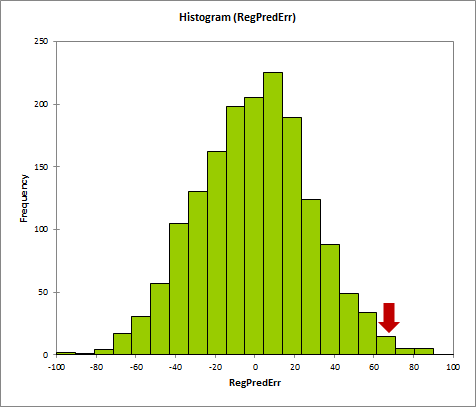
In other words, if we account for turnovers in our predictions, the expected/actual yardage discrepancy drops from ~125 to ~70 yards per game. This obv makes the results somewhat less extreme, though still pretty significant: 11th of 1647. Or, in histogram form:
So what’s the bottom line? At 69.5 yards per game, the total “missing” yardage drops to around 1100. Therefore, inasmuch as we accept it as an “explanation,” Green Bay’s turnover differential seems to account for about 900 yards.
It’s probably obvious, but important enough to say anyway, that there is extensive overlap between this “explanation” and our others above: E.g., the interception differential contributes to the possession differential, and is exacerbated by garbage time strategy, which causes the EPA/WPA differential, etc.
“Bend But Don’t Break”
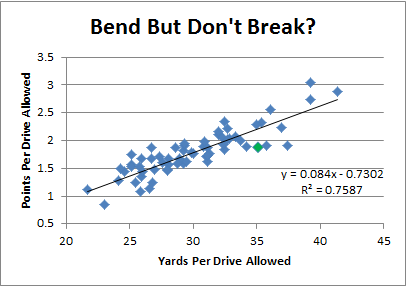
Finally, I have to address a potential cause of this anomaly that I would almost rather not: The elusive “Bend But Don’t Break” defense. It’s a bit like the Dark Matter of this scenario: I can prove it exists, and estimate about how much is there, but that doesn’t mean I have any idea what it is or where it comes from, and it’s almost certainly not as sexy as people think it is.
Typically, “Bend But Don’t Break” is the description that NFL analysts use for bad defenses that get lucky. As a logical and empirical matter, they mostly don’t make sense: Pretty much every team in history (save, possibly, the 2007 New England Patriots) has a steeply inclined expected points by field position curve. See, e.g., the “Drive Results” chart in this post. Any time you “bend” enough to give up first downs, you’re giving up expected points. In other words, barring special circumstances, there is simply no way to trade significant yards for a decreased chance of scoring.
Of course, you can have defenses that are stronger at defending various parts of the field, or certain down/distance combinations, which could have the net effect of allowing fewer points than you would expect based on yards allowed, but that’s not some magical defensive rope-a-dope strategy, it’s just being better at some things than others.
But for whatever reason, on a drive-by-drive basis, did the Green Bay defense “bend” more than it “broke”? In other words, did they give up fewer points than expected?
And the answer is “yes.” Which should be unsurprising, since it’s basically a minor variant of the original problem. In other words, it begs the question.
In fact, with everything that we’ve looked at so far, this is pretty much all that is left: if there weren’t a significant “Bend But Don’t Break” effect observable, the yardage anomaly would be literally impossible.
And, in fact, this observation “accounts” for about 650 yards, which, combined with everything else we’ve looked at (and assuming a modest amount of overlap), puts us in the ballpark of our initial 2000 yard discrepancy.
Extremely Speculative Conclusions
Some of the things that seem speculative above must be true, because there has to be an accounting: even if it’s completely random, dumb luck with no special properties and no elements of design, there still has to be an avenue for the anomaly to manifest.
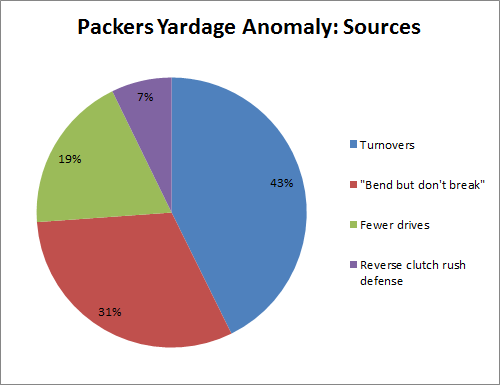
So, given that some speculation is necessary, the best I can do is offer a sort of “death by a thousand cuts” explanation. If we take the yardage explained by turnovers, the “dark matter” yards of “bend but don’t break”, and then roughly half of our speculated consequences of the fewer drives/zero yard TD’s and the “Garbage Time” reverse-clutch effect (to account for overlap), you actually end up with around 2100 yards, with a breakdown like so:
So why cut drives and reverse clutch in half instead of the others? Mostly just to be conservative. We have to account for overlap somewhere, and I’d rather leave more in the unknown than in the known.
At the end of the day, the stars definitely had to align for this anomaly to happen: Any one of the contributing factors may have been slightly unusual, but combine them and you get something rare.

I’m not sure if this would bring about a contribution, but could there be another consideration within the turnover margin. Namely, did something unusual occur in the location of turnovers for the Packers this season. If, for example, turnovers occurred later in a drive than the norm, this would account for an increased number of yards against.
[…] being outgained this year (5,198 to 4,713) but are still 11-3. It reminds me somewhat of 2011, when they were outgained (6,585 to 6,482) and went 15-1. (And then promptly lost to the Eli Manning Giants in the […]