Perhaps Baseball is truly America’s Sport, but it didn’t take the title of “most written about” until the mid-1980’s:

(Created with Google Books Ngram Viewer.)
Perhaps Baseball is truly America’s Sport, but it didn’t take the title of “most written about” until the mid-1980’s:
(Created with Google Books Ngram Viewer.)
Dennis Rodman is a – perhaps the – classic hard case for serious basketball valuation analysis. The more you study him, the more you are forced to engage in meta-analysis: that is, examining the advantages and limitations of the various tools in the collective analytical repertoire. Indeed, it’s even more than a hard case, it’s an extremely important one: it is just these conspicuously difficult situations where reliable analytical insight could be most useful, yet depending on which metric you choose, Rodman is either a below-average NBA player or one of the greatest of all time. Moreover, while Rodman may be an “extreme” of sorts, this isn’t Newtonian Physics: the problems with player valuation modeling that his case helps reveal – in both conventional and unconventional forms – apply very broadly.
This section will use Dennis Rodman as a case study for my broader critique of both conventional and unconventional player valuation methods. Sub-section (i) introduces my criticism and deals with conventional wisdom, and sub-section (ii) deals with unconventional wisdom and beyond. Section (b) will then examine how valuable Rodman was specifically, and why. Background here, here, here, here, and here.
Why is it that so many sports-fans pooh-pooh advanced statistical analysis, yet, when making their own arguments, spout nothing but statistics?
Indeed, the vast majority of people are virtually incapable of making sports arguments that aren’t stats-based in one way or another. Whether he knows it or not, Joe Average is constantly learning and refining his preferred models, which he then applies to various problems, for a variety of purposes — not entirely unlike Joe Academic. Yet chances are he remains skeptical of the crazy-talk he hears from the so-called “statistical experts” — and there is truth to this skepticism: a typical “fan” model is extremely flexible, takes many more variables from much more diverse data into account, and ultimately employs a very powerful neural network to arrive at its conclusions. Conversely, the “advanced” models are generally rigid, naïve, over-reaching, hubristic, prove much less than their creators believe, and claim even more. Models are to academics like screenplays are to Hollywood waiters: everyone has one, everyone thinks theirs is the best, and most of them are garbage. The broad reliability of “common sense” over time has earned it the benefit of the doubt, despite its high susceptibility to bias and its abundance of easily-provable errors.
The key is this: While finding and demonstrating such error is easy enough, successfully doing so should not – as it so often does – lead one (or even many) to presume that it qualifies them to replace that wisdom, in its entirety, with their own.
I believe something like this happened in the basketball analytic community: reacting to the manifest error in conventional player valuation, the statisticians have failed to recognize the main problem – one which I will show actually limits their usefulness – and instead have developed an “unconventional” wisdom that ultimately makes many of the same mistakes.
The standard line among sports writers and commentators today is that Dennis Rodman’s accomplishments “on the court” would easily be sufficient to land him in the Hall of Fame, but that his antics “off the court” may give the voters pause. This may itself be true, but it is only half the story: If, in addition to his other accomplishments, Rodman had scored 15 points a game, I don’t think we’d be having this discussion, or really even close to having this discussion (note, this would be true whether or not those 15 points actually helped his teams in any way). This is because the Hall of Fame reflects the long-standing conventional wisdom about player valuation: that points (especially per game) are the most important measure of a player’s (per game) contribution.
Whether most people would explicitly endorse this proposition or not, it is still reflected in systematic bias. The story goes something like this: People watch games to see the players do cool things, like throw a ball from a long distance through a tiny hoop, and experience pleasure when it happens. Thus, because pleasure is good, they begin to believe that those players must be the best players, which is then reinforced by media coverage that focuses on point totals, best dunks plays of the night, scoring streaks, scoring records, etc. This emphasis makes them think these must also be the most important players, and when they learn about statistics, that’s where they devote their attention. Everyone knows about Kobe’s 81 points in a game, but how many people know about Scott Skiles’s 30 assists? or Charles Oakley’s 35 rebounds? or Rodman’s 18 offensive boards? or Shaq’s 15 blocks? Many fans even know that Mark Price is the all-time leader in free throw percentage, or that Steve Kerr is the all-time leader in 3 point percentage, but most have never even heard of rebound percentage, much less assist percentage or block percentage. And, yes, for those who vote for the Hall of Fame, it is also reflected in their choices. Thus, before dealing with any fall-out for his off-court “antics,” the much bigger hurdle to Dennis Rodman’s induction looks like this:

This list is the bottom-10 per-game scorers (of players inducted within 25 years of their retirement). If Rodman were inducted, he would be the single lowest point-scorer in HoF history. And looking at the bigger picture, it may even be worse than that. Here’s a visual of all 89 Hall of Famers with stats (regardless of induction time), sorted from most points to fewest:

So not only would he be the lowest point scorer, he would actually have significantly fewer points than a (linear) trend-line would predict the lowest point scorer to have (and most of the smaller bars just to the left of Rodman were Veteran’s Committee selections). Thus, if historical trends reflect the current mood of the HoF electorate, resistance is to be expected.
The flip-side, of course, is the following:
 Note: this graphic only contains the players for whom this stat is available, though, as I demonstrated previously, there is no reason to believe that earlier players were any better.
Clearly, my first thought when looking at this data was, “Who the hell is this guy with a TRB% of only 3.4?” That’s only 1 out of every *30* rebounds!* The league average is (obviously) 1 out of 10. Muggsy Bogues — the shortest player in the history of the NBA (5’3”) — managed to pull in 5.1%, about 1 out of every 20. On the other side, of course, Rodman would pace the field by a wide margin – wider, even, than the gap between Jordan/Chamberlain and the field for scoring (above). Of course, the Hall of Fame traditionally doesn’t care that much about rebounding percentages:

So, of eligible players, 24 of the top 25 leaders in points per game are presently in the Hall (including the top 19 overall), while only 9 of the top 25 leaders in total rebound percentage can say the same. This would be perfectly rational if, say, PPG was way way more important to winning than TRB%. But this seems unlikely to me, for at least two reasons: 1) As a rate stat, TRB% shouldn’t be affected significantly by game or team pace, as PPG is; and 2) TRB% has consequences on both offense and defense, whereas PPG is silent about the number of points the player/team has given up. To examine this question, I set up a basic correlation of team stats to team winning percentage for the set of every team season since the introduction of the 3-point shot. Lo and behold, it’s not really close:

Yes, correlation does not equal causation, and team scoring and rebounding are not the same as individual scoring and rebounding. This test isn’t meant to prove conclusively that rebounding is more important than scoring, or even gross scoring — though, at the very least, I do think it strongly undermines the necessity of the opposite: that is, the assumption that excellence in gross point-scoring is indisputably more significant than other statistical accomplishments.
Though I don’t presently have the data to confirm, I would hypothesize (or, less charitably, guess) that individual TRB% probably has a more causative effect on team TRB% than individual PPG does on team PPG [see addendum] (note, to avoid any possible misunderstanding, I mean this only w/r/t PPG, not points-per-possession, or anything having to do with shooting percentages, true or otherwise). Even with the proper data, this could be a fairly difficult hypothesis to test, since it can be hard to tell (directly) whether a player scoring a lot of points causes his team to score a lot of points, or vice versa. However, that hypothesis seems to be at least partially supported by studies that others have conducted on rebound rates – especially on the offensive side (where Rodman obviously excelled).
The conventional wisdom regarding the importance of gross points is demonstrably flawed on at least two counts: gross, and points. In sub-section (ii), I will look at how the analytical community attempted to deal with these problems, as well as at how they repeated them.
*(It’s Tiny Archibald)
Addendum (4/20/11):
I posted this as a Graph of the Day a while back, and thought I should add it here:

More info in the original post, but the upshot is that my hypothesis that “individual TRB% probably has a more causative effect on team TRB% than individual PPG does on team PPG” appears to be confirmed (the key word is “differential”).
As some of you know, several months ago I applied for a position as a sports analytics specialist (amazing job description, and it even pays money). The evaluation process has been wild, including *8* rounds of assessments and interviews. I feel like I’ve made my case as about as well as I can, though from what I understand the competition is something fierce — so it could easily go either way. With a final outcome being (or at least seeming) imminent for quite a while now, I have held off on posting new material. In truth, this hiatus has been much longer than I expected, so my apologies to Dennis Rodman.
If I get the job, it is not clear what will happen to the blog, as I haven’t yet discussed it with my potential employers. But if I don’t get the job, I’m happy to report that the blog will proceed with my full commitment as well as my full-time attention. Specifically — as insisted by my wife – that means no fewer than 40 hours of work and 5 posts per week.
Out of fairness to my loyal reader(s), no matter what happens I will be publishing the remainder of the Rodman series, as well as my long-promised (and recently-revamped) Tennis Service Aggression Calculator, and any necessary follow-ups to other items, such as the following:
During the last NHL season, I noted that Alexander Ovechkin and Sidney Crosby had thus-far failed to break Wayne Gretzky’s single-season point-scoring record from 1984, combined. But I guess records are meant to be broken! With 109 each, AO and SC’s 218 points in the 09-10 season just edges Gretzky’s 215. Congrats, new guys!
Tiger has truly had a terrible year — on the golf course. I’ve updated this older graph to include the full season of data, though the upshot is basically the same:

Much has been made of Tiger losing his #1 overall ranking to Lee Westwood, but the situation is actually much more dire: If Tiger continues to play this poorly, he could be in danger of losing his status as an above average PGA golfer. Take a look at this summary of stats from his 2010 PGA season (from the PGA website):

Eliminating FedEx Cup Points and earnings from the list, he still averaged right around 87th for these measures (there are about 190 PGA regulars). His adjusted scoring average ranks 28th, which would itself be unthinkable for Tiger, but even 28th may be generous: the weighted figure is bolstered by relatively good showings in strong fields at the Masters and U.S. Open, but Tiger actually performed worse in weaker fields. Let’s quickly look at his unadjusted scoring (same source):

Tiger typically plays a tougher schedule than your average golfer, for sure, but that hasn’t stopped him in the past: he led the PGA in both adjusted AND unadjusted scoring average each of the past 5 seasons.
The St. Louis Rams are currently 6-6, which, oddly enough, puts them right about on track for 1-15 teams historically:

(So maybe my hypothesis has some teeth to it after all.)
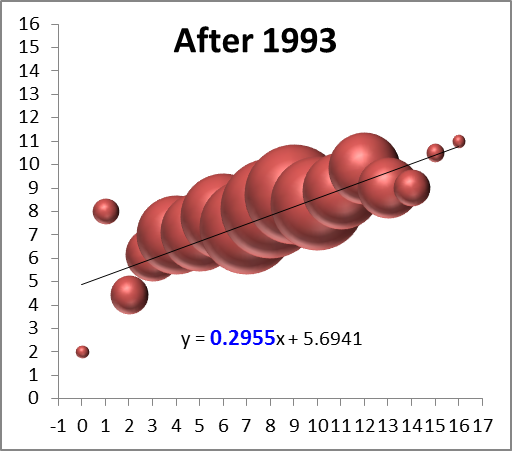
Relatedly, so far this has been a hallmark year for regression to the mean. Here is a scatterplot of 2010 wins by 2009 wins (functionally equivalent to the bubble charts in the Rams post):

That .18 coefficient is very low, even by recent standards. The coefficient for he equivalent trendline for season to season wins since the implementation of the salary cap in 1993 is .30.
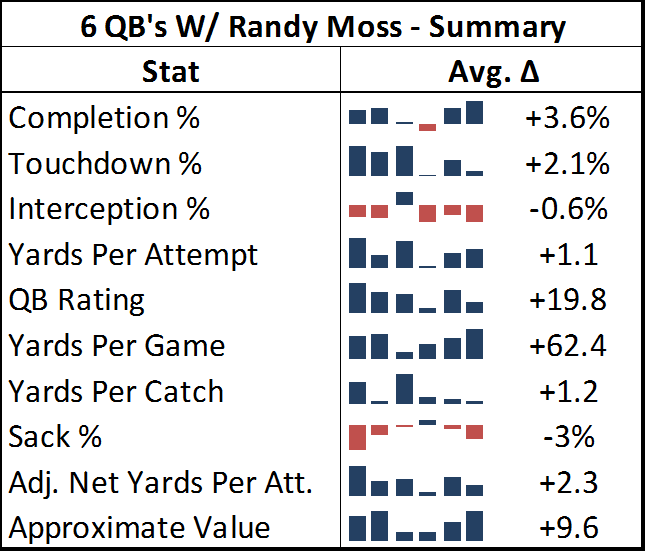
Randy Moss is having a nightmare year. Granted, he has had to play for 3 different teams and 5 different starting quarterbacks, but there is no evidence of him having his usual impact – either directly or indirectly. The good news is that he won’t reach 9 games with a single quarterback, and thus won’t spoil his nifty “WOWY” graphs. The bad news is that the Pats, Vikes, and Titans all have worse records with him in the line-up than without him.
At mid-season, ESPN Stats & Info applied a methodology similar to mine, and things didn’t look so bad. But Brady’s recent hot streak has mostly killed the disparity:

(Recall that even Favre’s 12 point difference in QB Rating is low by Moss’s standards).
Finally, I’ve been tracking the performance of my neural network’s predictions vs. Football Outsiders’ DVOA Projections and Advanced NFL Stats’ Koko model (Recall that in recent years, F.O. has performed the worst). Since the original metric I was using for comparison was correlation, which is sensitive to the number of games played, I can’t really do a precise analysis until the season is over. But suffice it to say: Football Outsiders has struck back — with a vengeance — and has a seemingly insurmountable lead going into the back stretch. On the other side, Koko is getting demolished. Since Koko is entirely based on the previous season’s win total, its poor performance is somewhat unsurprising considering the regression graph above (which, incidentally, Koko is not doing much better than). My neural network, meanwhile, is plugging along just slightly below its previous averages.
Giving credit where it’s due, this range of performance actually makes the F.O. predictions that much more impressive: normally, the previous season is either predictive or it’s not, and the models’ performances tend to move together. My speculation would be that perhaps the many exogenous variables that F.O. uses and the other models don’t are particularly important this year.