A couple of days ago, ESPN’s Peter Keating blogged about “icing the kicker” (i.e., calling timeouts before important kicks, sometimes mere instants before the ball is snapped). He argues that the practice appears to work, at least in overtime. Ultimately, however, he concludes that his sample is too small to be “statistically significant.” This may be one of the few times in history where I actually think a sports analyst underestimates the probative value of a small sample: as I will show, kickers are generally worse in overtime than they are in regulation, and practically all of the difference can be attributed to iced kickers. More importantly, even with the minuscule sample Keating uses, their performance is so bad that it actually is “significant” beyond the 95% level.
In Keating’s 10 year data-set, kickers in overtime only made 58.1% of their 35+ yard kicks following an opponent’s timeout, as opposed to 72.7% when no timeout was called. The total sample size is only 75 kicks, 31 of which were iced. But the key to the analysis is buried in the spreadsheet Keating links to: the average length of attempted field goals by iced kickers in OT was only 41.87 yards, vs. 43.84 yards for kickers at room temperature. Keating mentions this fact in passing, mainly to address the potential objection that perhaps the iced kickers just had harder kicks — but the difference is actually much more significant.
To evaluate this question properly, we first need to look at made field goal percentages broken down by yard-line. I assume many people have done this before, but in 2 minutes of googling I couldn’t find anything useful, so I used play-by-play data from 2000-2009 to create the following graph:

The blue dots indicate the overall field-goal percentage from each yard-line for every field goal attempt in the period (around 7500 attempts total – though I’ve excluded the one 76 yard attempt, for purely aesthetic reasons). The red dots are the predicted values of a logistic regression (basically a statistical tool for predicting things that come in percentages) on the entire sample. Note this is NOT a simple trend-line — it takes every data point into account, not just the averages. If you’re curious, the corresponding equation (for predicted field goal percentage based on yard line x) is as follows:
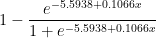
The first thing you might notice about the graph is that the predictions appear to be somewhat (perhaps unrealistically) optimistic about very long kicks. There are a number of possible explanations for this, chiefly that there are comparatively few really long kicks in the sample, and beyond a certain distance the angle of the kick relative to the offensive and defensive linemen becomes a big factor that is not adequately reflected by the rest of the data (fortunately, this is not important for where we are headed). The next step is to look at a similar graph for overtime only — since the sample is so much smaller, this time I’ll use a bubble-chart to give a better idea of how many attempts there were at each distance:

For this graph, the sample is about 1/100th the size of the one above, and the regression line is generated from the OT data only. As a matter of basic spatial reasoning — even if you’re not a math whiz — you may sense that this line is less trustworthy. Nevertheless, let’s look at a comparison of the overall and OT-based predictions for the 35+ yard attempts only:

Note: These two lines are slightly different from their counterparts above. To avoid bias created by smaller or larger values, and to match Keating’s sample, I re-ran the regressions using only 35+ yard distances that had been attempted in overtime (they turned out virtually the same anyway).
Comparing the two models, we can create a predicted “Choke Factor,” which is the percentage of the original conversion rate that you should knock off for a kicker in an overtime situation:

A weighted average (by the number of OT attempts at each distance) gives us a typical Choke Factor of just over 6%. But take this graph with a grain of salt: the fact that it slopes upward so steeply is a result of the differing coefficients in the respective regression equations, and could certainly be a statistical artifact. For my purposes however, this entire digression into overtime performance drop-offs is merely for illustration: The main calculation relevant to Keating’s iced kick discussion is a simple binomial probability: Given an average kick length of 41.87 yards, which carries a predicted conversion rate of 75.6%, what are the odds of converting only 18 or fewer out of 31 attempts? OK, this may be a mildly tricky problem if you’re doing it longhand, but fortunately for us, Excel has a BINOM.DIST() function that makes it easy:

Note : for people who might not pick: Yes, the predicted conversion rate for the average length is not going to be exactly the same as the average predicted value for the length of each kick. But it is very close, and close enough.
As you can see, the OT kickers who were not iced actually did very slightly better than average, which means that all of the negative bias observed in OT kicking stems from the poor performance seen in just 31 iced kick attempts. The probability of this result occurring by chance — assuming the expected conversion rate for OT iced kicks were equal to the expected conversion rate for kicks overall — would be only 2.4%. Of course, “probability of occurring by chance” is the definition of statistical significance, and since 95% against (i.e., less than 5% chance of happening) is the typical threshold for people to make bold assertions, I think Keating’s statement that this “doesn’t reach the level of improbability we need to call it statistically significant” is unnecessarily humble. Moreover, when I stated that the key to this analysis was the 2 yard difference that Keating glossed over, that wasn’t for rhetorical flourish: if the length of the average OT iced kick had been the same as the length of the average OT regular kick, the 58.1% would correspond to a “by chance” probability of 7.6%, obviously not making it under the magic number.
Ben:
Nice analysis.
Your conclusion might be strengthened by taking the late 4th quarter field goal attempts from close games and lumping them with the OT attempts. Those data points range from exactly like OT kicks (tie game, last play of regulation) to something more like OT kicks than regulation kicks (close game, less than 3 minutes to go). Heck, rough justice could be accomplished just by lumping all field goals with less than 5 minutes to play in with the OT kicks.
I’d be interested to see the data broken by quarter, as well. In theory, if the sample is large and fine grained enough, we should see a steady increase in choking as the 2nd half of games moves on (attenuated by the score at the time, of course).
mattt
Hi Matt,
Strictly speaking, I’m not drawing any conclusions other than that Keating was incorrect to say that his results were not “statistically significant,” at least by conventional understanding of the term (somehow I think that wouldn’t make as good of a headline). Of course, an actual study of kicking performance by situation could be informative. I’ll keep it in mind.