The Case for Dennis Rodman, Part 1/4 (b)—Defying the Laws of Nature

In this post I will be continuing my analysis of just how dominant Dennis Rodman’s rebounding was.  Subsequently, section (c) will cover my analysis of Wilt Chamberlain and Bill Russell, and Part 2 of the series will begin the process of evaluating Rodman’s worth overall.

For today’s analysis, I will be examining a particularly remarkable aspect of Rodman’s rebounding: his ability to dominate the boards on both ends of the court.  I believe this at least partially gets at a common anti-Rodman argument: that his rebounding statistics should be discounted because he concentrated on rebounding to the exclusion of all else.  This position was publicly articulated by Charles Barkley back when they were both still playing, with Charles claiming that he could also get 18+ rebounds every night if he wanted to.  Now that may be true, and it’s possible that Rodman would have been an even better player if he had been more well-rounded, but one thing I am fairly certain of is that Barkley could not have gotten as many rebounds as Rodman the same way that Rodman did.

The key point here is that, normally, you can be a great offensive rebounder, or you can be a great defensive rebounder, but it’s very hard to be both.  Unless you’re Dennis Rodman:

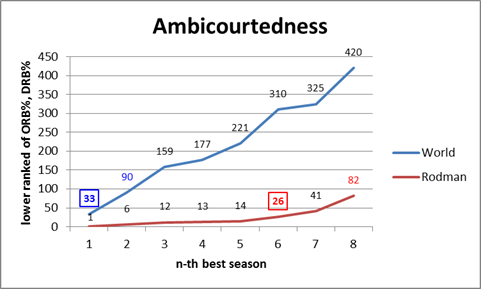
To prepare the data for this graph, I took the top 1000 rebounding seasons by total rebounding percentage (the gold-standard of rebounding statistics, as discussed in section (a)), and ranked them 1-1000 for both offensive (ORB%) and defensive (DRB%) rates.  I then scored each season by the higher (larger number) ranking of the two.  E.g., if a particular season scored a 25, that would mean that it ranks in the top 25 all-time for offensive rebounding percentage and in the top 25 all-time for defensive rebounding percentage (I should note that many players who didn’t make the top 1000 seasons overall would still make the top 1000 for one of the two components, so to be specific, these are the top 1000 ORB% and DRB% seasons of the top 1000 TRB% seasons).

This score doesn’t necessarily tell us who the best rebounder was, or even who was the most balanced, but it should tell us who was the strongest in the weakest half of their game (just as you might rank the off-hand of boxers or arm wrestlers).  Fortunately, however, Rodman doesn’t leave much room for doubt:  his 1994-1995 season is #1 all-time on both sides.  He has 5 seasons that are dual top-15, while no other NBA player has even a single season that ranks dual top-30.  The graph thus shows how far down you have to go to find any player with n number of seasons at or below that ranking: Rodman has 6 seasons register on the (jokingly titled) “Ambicourtedness” scale before any other player has 1, and 8 seasons before any player has 2 (for the record, Charles Barkley’s best rating is 215).

This outcome is fairly impressive alone, and it tells us that Rodman was amazingly good at both ORB and DRB – and that this is rare — but it doesn’t tell us anything about the relationship between the two.  For example, if Rodman just got twice as many rebounds as any normal player, we would expect him to lead lists like this regardless of how he did it.  Thus, if you believe the hypothesis that Rodman could have dramatically increased his rebounding performance just by focusing intently on rebounds, this result might not be unexpected to you.

The problem, though, is that there are both competitive and physical limitations to how much someone can really excel at both simultaneously. Not the least of which is that offensive and defensive rebounds literally take place on opposite sides of the floor, and not everyone gets up and set for every possession.  Thus, if someone wanted to cheat toward getting more rebounds on the offensive end, it would likely come, at least in some small part, at the expense of rebounds on the defensive end.  Similarly, if someone’s playing style favors one, it probably (at least slightly), disfavors the other.  Whether or not that particular factor is in play, at the very least you should expect a fairly strong regression to the mean: thus, if a player is excellent at one or the other, you should expect them to be not as good at the other, just as a result of the two not being perfectly correlated.  To examine this empirically, I’ve put all 1000 top TRB% seasons on a scatterplot comparing offensive and defensive rebound rates:

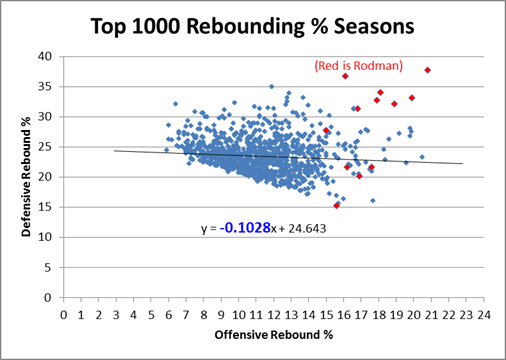
Clearly there is a small negative correlation, as evidenced by the negative coefficient in the regression line.  Note that technically, this shouldn’t be a linear relationship overall – if we graphed every pair in history from 0,0 to D,R, my graph’s trendline would be parallel to the tangent of that curve as it approaches Dennis Rodman.  But what’s even more stunning is the following:

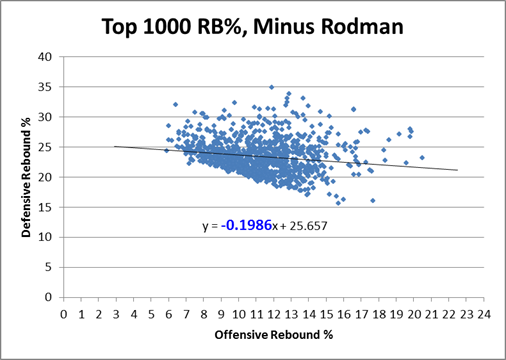
Rodman is in fact not only an outlier, he is such a ridiculously absurd alien-invader outlier that when you take him out of the equation, the equation changes drastically:  The negative slope of the regression line nearly doubles in Rodman’s absence.  In case you’ve forgotten, let me remind you that Rodman only accounts for 12 data points in this 1000 point sample: If that doesn’t make your jaw drop, I don’t know what will!  For whatever reason, Rodman seems to be supernaturally impervious to the trade-off between offensive and defensive rebounding.  Indeed, if we look at the same graph with only Rodman’s data points, we see that, for him, there is actually an extremely steep, upward sloping relationship between the two variables:

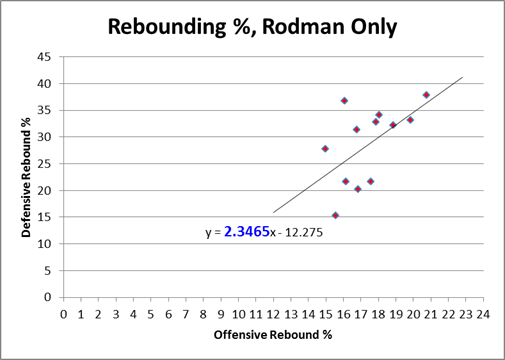
In layman’s terms, what this means is that Rodman comes in varieties of Good, Better, and Best — which is how we would expect this type of chart to look if there were no trade-off at all.  Yet clearly the chart above proves that such a tradeoff exists!  Dennis Rodman almost literally defies the laws of nature (or at least the laws of probability).

The ultimate point contra Barkley, et al, is that if Rodman “cheated” toward getting more rebounds all the time, we might expect that his chart would be higher than everyone else’s, but we wouldn’t have any particular reason to expect it to slope in the opposite direction.  Now, this is slightly more plausible if he was “cheating” on the offensive side on the floor while maintaining a more balanced game on the defensive side, and there are any number of other logical speculations to be made about how he did it.  But to some extent this transcends the normal “shift in degree” v. “shift in kind” paradigm:  what we have here is a major shift in degree of a shift in kind, and we don’t have to understand it perfectly to know that it is otherworldly.  At the very least, I feel confident in saying that if Charles Barkley or anyone else really believes they could replicate Rodman’s results simply by changing their playing styles, they are extremely naive.


Addendum (4/20/11):

Commenter AudacityOfHoops asks:

I don’t know if this is covered in later post (working my way through the series – excellent so far), or whether you’ll even find the comment since it’s 8 months late, but … did you create that same last chart, but for other players? Intuitively, it seems like individual players could each come in Good/Better/Best models, with positive slopes, but that when combined together the whole data set could have a negative slope.

I actually addressed this in an update post (not in the Rodman series) a while back:

A friend privately asked me what other NBA stars’ Offensive v. Defensive rebound % graphs looked like, suggesting that, while there may be a tradeoff overall, that doesn’t necessarily mean that the particular lack of tradeoff that Rodman shows is rare. This is a very good question, so I looked at similar graphs for virtually every player who had 5 or more seasons in the “Ambicourtedness Top 1000.” There are other players who have positively sloping trend-lines, though none that come close to Rodman’s. I put together a quick graph to compare Rodman to a number of other big name players who were either great rebounders (e.g., Moses Malone), perceived-great rebounders (e.g., Karl Malone, Dwight Howard), or Charles Barkley:

Top 1000_11343_image001

By my accounting, Moses Malone is almost certainly the 2nd-best rebounder of all time, and he does show a healthy dose of “ambicourtedness.” Yet note that the slope of his trendline is .717, meaning the difference between him and Rodman’s 2.346 is almost exactly twice the difference between him and the -.102 league average (1.629 v .819).

The Case for Dennis Rodman, Part 1/4 (a)—Rodman v. Jordan

For reasons which should become obvious shortly, I’ve split Part 1 of this series into sub-parts. This section will focus on rating Rodman’s accomplishments as a rebounder (in painstaking detail), while the next section(s) will deal with the counterarguments I mentioned in my original outline.

For the uninitiated, the main stat I will be using for this analysis is “rebound rate,” or “rebound percentage,” which represents the percentage of available rebounds that the player grabbed while he was on the floor.  Obviously, because there are 10 players on the floor for any given rebound, the league average is 10%.  The defensive team typically grabs 70-75% of rebounds overall, meaning the average rates for offensive and defensive rebounds are approximately 5% and 15% respectively.  This stat is a much better indicator of rebounding skill than rebounds per game, which is highly sensitive to factors like minutes played, possessions per game, and team shooting and shooting defense.  Unlike many other “advanced” stats out there, it also makes perfect sense intuitively (indeed, I think the only thing stopping it from going completely mainstream is that the presently available data can technically only provide highly accurate “estimates” for this stat.  When historical play-by-play data becomes more widespread, I predict this will become a much more popular metric).

Dennis Rodman has dominated this stat like few players have dominated any stat.  For overall rebound % by season, not only does he hold the career record, he led the league 8 times, and holds the top 7 spots on the all-time list (red bars are Rodman):

Note this chart only goes back as far as the NBA/ABA merger in 1976, but going back further makes no difference for the purposes of this argument.  As I will explain in my discussion of the “Wilt Chamberlain and Bill Russell Were Rebounding Gods” myth, the rebounding rates for the best rebounders tend to get worse as you go back in time, especially before Moses Malone.
As visually impressive as that chart may seem, it is only the beginning of the story.  Obviously we can see that the Rodman-era tower is the tallest in the skyline, but our frame of reference is still arbitrary: e.g., if the bottom of the chart started at 19 instead of 15, his numbers would look even more impressive.  So one thing we can do to eliminate bias is put the average in the middle, and count percentage points above or below, like so:

With this we get a better visual sense of the relative greatness of each season.  But we’re still left with percentage points as our unit of measurement, which is also arbitrary: e.g., how much better is “6%” better?  To answer this question, in addition to the average, we need to calculate the standard deviation of the sample (if you’re normally not comfortable working with standard deviations, just think of them as standardized units of measurement that can be used to compare stats of different types, such as shooting percentages against points per game).  Then we re-do the graph using standard deviations above or below the mean, like so:

Note this graph is actually exactly the same shape as the one above, it’s just compressed to fit on a scale from –3 to +8 for easy comparison with subsequent graphs.  The SD for this graph is 2.35%.
There is one further, major, problem with our graph: As strange as it may sound, Dennis Rodman’s own stats are skewing the data in a way that biases the comparison against him.  Specifically, with the mean and standard deviation set where they are, Rodman is being compared to himself as well as to others.  E.g., notice that most of the blue bars in the graph are below the average line: this is because the average includes Rodman.  For most purposes, this bias doesn’t matter much, but Rodman is so dominant that he raises the league average by over a percent, and he is such an outlier that he alone nearly doubles the standard deviation.  Thus, for the remaining graphs targeting individual players, I’ve calculated the average and standard deviations for the samples from the other players only:

Note that a negative number in this graph is not exactly a bad thing: that person still led the league in rebounding % that year.  The SD for this graph is 1.22%.
But not all rebounding is created equal: Despite the fact that they get lumped together in both conventional rebounding averages and in player efficiency ratings, offensive rebounding is worth considerably more than defensive rebounding.  From a team perspective, there is not much difference (although not necessarily *no* difference – I suspect, though I haven’t yet proved, that possessions beginning with offensive rebounds have higher expected values than those beginning with defensive rebounds), but from an individual perspective, the difference is huge.  This is because of what I call “duplicability”: simply put, if you failed to get a defensive rebound, there’s a good chance that your team would have gotten it anyway.  Conversely, if you failed to get an offensive rebound, the chances of your team having gotten it anyway are fairly small.  This effect can be very crudely approximated by taking the league averages for offensive and defensive rebounding, multiplying by .8, and subtracting from 1.  The .8 comes from there being 4 other players on your team, and the subtraction from 1 gives you the value added for each rebound: The league averages are typically around 25% and 75%, so, very crudely, you should expect your team to get around 20% of the offensive and 60% of the defensive rebounds that you don’t.  Thus, each offensive rebound is adding about .8 rebounds to your team’s total, and each defensive rebound is adding about .4.  There are various factors that can affect the exact values one way or the other, but on balance I think it is fair to assume that offensive rebounds are about twice as valuable overall.

To that end, I calculated an adjusted rebounding % for every player since 1976 using the formula (2ORB% + DRB%)/3, and then ran it through all of the same steps as above:

Mindblowing, really.  But before putting this graph in context, a quick mathematical aside:  If these outcomes were normally distributed, a 6 standard deviation event like Rodman’s 1994-1995 season would theoretically happen only about once every billion seasons.  But because each data point on this chart actually represents a maximum of a large sample of (mostly) normally distributed seasonal rebounding rates, they should instead be governed by the Gumbel distribution for extreme values: this leads to a much more manageable expected frequency of approximately once every 400 years (of course, that pertains to the odds of someone like Rodman coming along in the first place; now that we’ve had Rodman, the odds of another one showing up are substantially higher).  In reality, there are so many variables at play from era to era, season to season, or even team to team, that a probability model probably doesn’t tell us as much as we would like (also, though standard deviations converge fairly quickly, the sample size is relatively modest).

Rather than asking how abstractly probable or improbable Rodman’s accomplishments were, it may be easier to get a sense of his rebounding skill by comparing this result to results of the same process for other statistics.  To start with, note that weighting the offensive rebounding more heavily cuts both ways for Rodman: after the adjustment, he only holds the top 6 spots in NBA history, rather than the top 7.  On the other hand, he led the league in this category 10 times instead of 8, which is perfect for comparing him to another NBA player who led a major statistical category 10 times — Michael Jordan:

Red bars are Jordan.  Mean and standard deviation are calculated from 1976, excluding MJ, as with Rodman above.

As you can see, the data suggests that Rodman was a better rebounder than Jordan was a scorer.  Of course, points per game isn’t a rate stat, and probably isn’t as reliable as rebounding %, but that cuts in Rodman’s favor.  Points per game should be more susceptible to varying circumstances that lead to extreme values.  Compare, say, to a much more stable stat, Hollinger’s player efficiency rating:

Actually, it is hard to find any significant stat where someone has dominated as thoroughly as Rodman.  One of the closest I could find is John Stockton and the extremely obscure “Assist %” stat:

Red bars are Stockton, mean and SD are calculated from the rest.

Stockton amazingly led the league in this category 15 times, though he didn’t dominate individual seasons to the extent that Rodman did.  This stat is also somewhat difficult to “detangle” (another term/concept I will use frequently on this blog), since assists always involve more than one player.  Regardless, though, this graph is the main reason John Stockton is (rightfully) in the Hall of Fame today.  Hmm…

The Case for Dennis Rodman, Part 0/4—Outline

[Note: Forgive the anachronisms, but since this page is still the landing-spot for a lot of new readers, I’ve added some links to the subsequent articles into this post. There is also a much more comprehensive outline of the series, complete with a table of relevant points and a selection of charts and graphs available in The Case for Dennis Rodman: Guide.]

If you’ve ever talked to me about sports, you probably know that one of my pet issues (or “causes” as my wife calls them), is proving the greatness of Dennis Rodman.  I admit that since I first saw Rodman play — and compete, and rebound, and win championships — I have been fascinated.  Until recently, however, I thought of him as the ultimate outlier: someone who seemed to have unprecedented abilities in some areas, and unprecedented lack of interest in others.  He won, for sure, but he also played for the best teams in the league.  His game was so unique — yet so enigmatic — that despite the general feeling that there was something remarkable going on there, opinions about his ultimate worth as a basketball player varied immensely — as they continue to today.  In this four-part series, I will attempt to end the argument.

While there may be room for reasonable disagreement about his character, his sportsmanship, or how and whether to honor his accomplishments, my research and analysis has led me to believe — beyond a reasonable doubt — that Rodman is one of the most undervalued players in NBA history.  From an analytical perspective, leaving him off of the Hall of Fame nominee list this past year was truly a crime against reason.  But what makes this issue particularly interesting to me is that it cuts “across party lines”:  the conventional wisdom and the unconventional wisdom both get it very wrong.  Thus, by examining the case of Dennis Rodman, not only will I attempt to solve a long-standing sports mystery, but I will attempt to illustrate a few flaws with the modern basketball-analytics movement.

In this post I will outline the major prongs of my argument.  But first, I would like to list the frequently-heard arguments I will *not* be addressing:

  • “Rodman won 5 NBA titles!  Anyone who is a starter on 5 NBA champions deserves to be in the Hall of Fame!”  [As an intrinsic matter, I really don’t care that he won 5 NBA championships, except inasmuch as I’d like to know how much he actually contributed.  I.e., is he more like Robert Horry, or more like Tim Duncan?]
  • “Rodman led the league in rebounding *7 times*:  Anyone who leads the league in a major statistical category that many times deserves to be in the Hall of Fame!” [This is completely arbitrary.  Rodman’s rebounding prowess is indeed an important factor in this inquiry, but “leading the league” in some statistical category has no intrinsic value, except inasmuch as it actually contributed to winning games.]
  • “Rodman was a great defender!  He could effectively defend Michael Jordan and Shaquille O’Neal in their primes!  Who else could do that?” [Actually, I love this argument as a rhetorical matter, but unfortunately I think defensive skill is still too subjective to be quantified directly. Of course all of his skills — or lack thereof — are relevant to the bottom line.]
  • “Rodman was such an amazing rebounder, despite being only 6 foot 7!” [Who cares how tall he was, seriously?]

Rather, in the subsequent parts in this series, these are the arguments I will be making:

  1. Rodman was a better rebounder than you think: Rodman’s ability as a rebounder is substantially underrated.  Rodman was a freak, and is unquestionably — by a wide margin — the greatest rebounder in NBA history.  In this section I will use a number of statistical metrics to demonstrate this point (preview factoid: Kevin Garnett’s career rebounding percentage is lower than Dennis Rodman’s career *offensive* rebounding percentage).  I will also specifically rebut two common counterarguments: 1) that Rodman “hung out around the basket”, and only got so many rebounds because he focused on it exclusively [he didn’t], and 2) that Bill Russell and Wilt Chamberlain were better rebounders [they weren’t].
  2. Rodman’s rebounding was more valuable than you think: The value of Rodman’s rebounding ability is substantially underrated.  Even/especially by modern efficiency metrics that do not accurately reward the marginal value of extra rebounds.  Conversely, his lack of scoring ability is vastly overrated, even/especially by modern efficiency metrics that inaccurately punish the marginal value of not scoring.
  3. Rodman was a bigger winner than you think: By examining Rodman’s +/- with respect to wins and losses — i.e., comparing his teams winning percentages with him in the lineup vs. without him in the lineup — I will show that the outcomes suggest he had elite-level value.  Contrary to common misunderstanding, this actually becomes *more* impressive after adjusting for the fact that he played on very good teams to begin with.
  4. Rodman belongs in the Hall of Fame [or not]: [Note this section didn’t go off as planned.  Rodman was actually selected for the HoF before I finished the series, so section 4 is devoted to slightly more speculative arguments about Rodman’s true value.]  Having wrapped up the main quantitative prongs, I will proceed to audit the various arguments for and against Rodman’s induction into the Hall of Fame.  I believe that both sides of the debate are rationalizable — i.e., there exist reasonable sets of preferences that would justify either outcome.  Ultimately, however, I will argue that the most common articulated preferences, when combined with a proper understanding of the available empirical evidence, should compel one to support Rodman‘s induction.  To be fair, I will also examine which sets of preferences could rationally compel you to the opposite conclusion.

Stay tuned….

Player Efficiency Ratings—A Bold ESPN Article Gets it Exactly Wrong

Tom Haberstroh, credited as a “Special to ESPN Insider” in his byline, writes this 16 paragraph article, about how “Carmelo Anthony is not an elite player.” Haberstroh boldly — if not effectively — argues that Carmelo’s high shot volume and correspondingly pedestrian Player Efficiency Rating suggests that not only is ‘Melo not quite the superstar his high scoring average makes him out to be, but that he is not even worth the max contract he will almost certainly get next summer.  Haberstroh further argues that this case is, in fact, a perfect example of why people should stop paying as much attention to Points Per Game and start focusing instead on PER’s.

I have a few instant reactions to this article that I thought I would share:

  1. Anthony may or may not be overrated, and many of Haberstroh’s criticisms on this front are valid — e.g., ‘Melo does have a relatively low shooting percentage — but his evidence is ultimately inconclusive.
  2. Haberstroh’s claim that Anthony is not worth a max contract is not supported at all.  How many players are “worth” max contracts?  The very best players, even with their max contracts, are incredible value for their teams (as evidenced by the fact that they typically win).  Corollary to this, there are almost certainly a number of players who are *not* the very best, who nevertheless receive max contracts, and who still give their teams good value at their price.  (This is not to mention the fact that players like Anthony, even if they are overrated, still sell jerseys, increase TV ratings, and put butts in seats.)
  3. One piece of statistical evidence that cuts against Haberstroh’s argument is that Carmelo has a very solid win/loss +/- with the Nuggets over his career.  With Melo in the lineup, Denver has won 59.9% of their games (308-206), and without him in the lineup over that period, they have won 50% (30-30).  While 10% may not sound like much, it is actually elite and compares favorably to the win/loss +/- of many excellent players, such as Chris Bosh (9.1%, and one of the top PER players in the league) and Kobe Bryant (4.1%).  All of these numbers should be treated with appropriate skepticism due to the small sample sizes, but they do trend accurately.

But the main point I would like to make is that — exactly opposite Haberstrom — I believe Carmelo Anthony is, in fact, a good example of why people should be *more* skeptical of PER’s as the ultimate arbiter of player value. One of the main problems with PER is that it attempts to account for whether a shot’s outcome is good or bad relative to the average shot, but it doesn’t account for whether the outcome is good or bad relative to the average shot taken in context.  The types of shots a player is asked to take vary both dramatically and systematically, and can thus massively bias his PER.  Many “bad” shots, for example, are taken out of necessity: when the clock is winding down and everyone is defended, someone has to chuck it up.  In that situation, “bad” shooting numbers may actually be good, if they are better than what a typical player would have done.  If the various types of shots were distributed equally, this would all average out in the end, and would only be relevant as a matter of precision.  But in reality, certain players are asked to take the bad shot more often that others, and those players are easy enough to find: they tend to be the best players on their teams.

This doesn’t mean I think PER is useless, or irreparably broken.  Among other things, I think it could be greatly improved by incorporating shot-clock data as a proxy to model the expected value of each shot (which I hope to write more about in the future).  However, in its current form it is far from being the robust and definitive metric that many basketball analysts seem to believe.  Points Per Game may be an even more useless metric — theoretically — but at least it’s honest.