One of my favorite stat-nuggets ever is that “Larry Bird never had a losing month.” So, yesterday, I figured it was about time to check whether or not it’s, you know, true.
To do this, I first had to figure out which Celtics games Bird actually played in. The problem there is that his career began well before 1986, meaning the box score data aren’t in Basketball Reference’s database. But they do have images of the actual box scores, like so:
Fortunately, Bird played in every game in his first two seasons, so figuring this out was just a matter of poring through 4 years of these pics: Easy peasy! (I’ve done more grueling work for even more trivial questions, to be sure.) But results on that later.
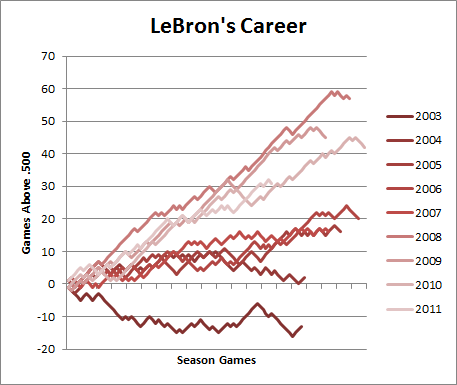
Independently, I was trying to come up with a fun way to illustrate the fact that LeBron James won a lot more games in his last two seasons on the lowly Cleveland Cavaliers than he has so far on the perma-hyped Miami Heat:
So that graph reflects every game of LeBron’s career, including the regular season and playoffs (through last night). It’s pretty straightforward: With LeBron an 18-year-old rookie, the Cavs (though much improved) were still pretty shaky, and they pretty much got better and better each year. After a slight decline from their soaring 2008 performance, LeBron left to join the latest Big 3—which is a solid contender, but no threat to the greatest Big 3. (BTW, I would like to thank the Heat for becoming Exhibit A for my long-time contention that having multiple “primary” options is less valuable than having a well-designed supporting cast—even one with considerably less talent.)
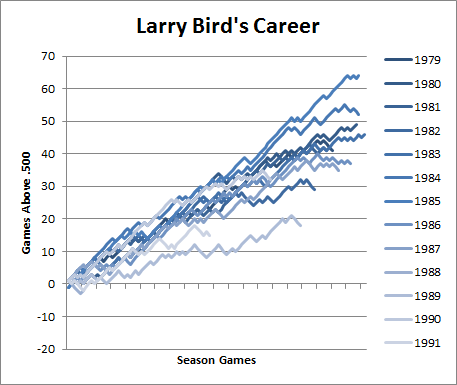
But with Mr. Trifecta on my mind (not to mention overloading my browser history), I thought it might be fun to compare the two leading contenders for the small forward spot on any NBA GOAT team. So here’s Larry:
Wow, pretty crazy consistent, yes? Keep in mind that, despite the Celtics long winning tradition, they only won 29 games the year before Bird’s arrival. Note the practically opposite gradient from LeBron’s: Bird started out hot, and basically stayed hot until injuries cooled him down.
As for the results of the original inquiry: It turns out Bird’s Celtics started the season 2-4 in November 1988, just before Bird had season-ending ankle surgery (of course, Bird’s 1988 games ARE in my database, so this was a bit of a “Doh!” finding). And, of course, he also had losing months in the playoffs.
His worst full month in the regular season, however, was indeed exactly .500: He went 8-8 in March of 1982. So, properly qualified (like, “In the regular season, Bird never had a losing month in which he played more than 6 games”), the claim holds up. If I were a political fact-checker, I would deem it “Mostly True.”
In case you’re interested, here is the complete list of months in Larry Bird’s career:
[table “10” not found /]


Based on your research would you say this version of the Heat or the Cavs with Lebron would me more favored to win a championship? I think this is the second time you have mentioned that you think the Cavs were better than the Heat are now, but would the qualities that make them a better regular season team also make them more likely to win a championship? Kind of going off your “multiple primary options” tangent.
Also I am a big fan of the frequency of posts, keep up the great work!
That’s a good question, the post-season is obv different. Though, despite failing to win a championship, Cleveland was actually a pretty strong post-season team. I don’t think there’s enough information at this point to say for sure.