|
Post
|
Rodman-Specific
|
Broader Analytical
|
|
Part 1(a): Rodman vs. Jordan
|
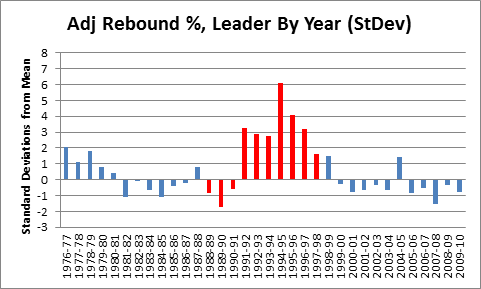
- Dennis Rodman has dominated Rebounding Percentage more than anyone has dominated any major stat.
- Before Rodman, we should have expected a rebounder of that quality to appear about once every 400 years.
|
- Use standard deviations to measure relative greatness
- Outliers can skew their own data against them
|
|
Part 1(b): Defying the Laws of Nature
|
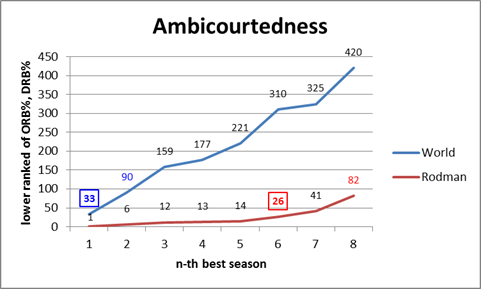
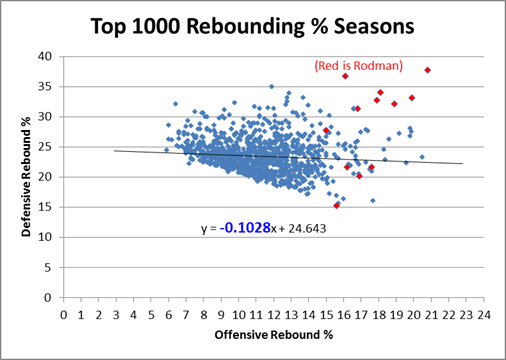
- Rodman had an almost unnatural ability to dominate rebounding on both ends of the court simultaneously
- Rodman showed no trade-off between offensive and defensive rebounding rates
|
- The trade-off between offensive and defensive rebounding exists, and is generally a completely separate phenomenon from rebounding ability.
|
|
Part 1(c): Rodman vs. Ancient History
|
- Contrary to popular opinion, Rodman was a much better rebounder than Wilt Chamberlain or Bill Russell, and it’s not close
|
- Total Rebound Percentages for players prior to 1970 can be estimated with extreme accuracy
|
|
Part 2(a)(i): Player Valuation and Conventional Wisdom
|
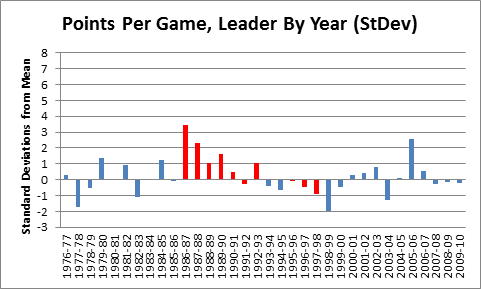
- On induction, Rodman will be the worst scorer and the best rebounder in the Hall of Fame
- Rodman scored even less than we would expect the lowest scoring Hall of Famer to have
- Rodman was an even better rebounder than we would expect the best rebounder in the Hall of Fame to be
- The Hall of Fame likes point-scorers better
|
- Everyone uses statistics, yet no one listens to statisticians—in part because statisticians build overreaching models, then believe and defend them
- Rebounding percentage correlates more strongly with winning than points per game.
- Added: Individual rebounding percentage has a more causative effect on team rebounding percentage than individual PPG does on team PPG.
|
|
Part 2(a)(ii): Player Valuation and Unconventional Wisdom
|
- Player Efficiency Rating ranks Dennis Rodman as the 7th best player on the 1995-96 Bulls championship team
- Player Efficiency Rating is terrible
- Extreme rebounding ability like Rodman’s may have exponential value
|
- Player Efficiency Rating fails completely as a predictor of true player value
- PER rewards Usage rate (shooting), despite no correlation between Usage and shot efficiency
- PER’s many layers of complications and adjustments are demonstrably counterproductive
|
|
Part 2(b): With or Without Worm
|
- Rodman has the highest Margin of Victory differential of any player since 1986 with a remotely similar sample size
- Rodman’s value comes mostly from extra possessions from extra rebounds
- Despite claims that he was exclusively a defensive player, Rodman’s teams played significantly better on offense with him in the lineup, even after accounting for his offense rebounding
|
- Introduce my brand of game-by-game “With or Without You” stats
- Two main areas of player impact: Reciprocal Opportunities, and Reciprocal Efficiency
- Impact on one aspect of a game can easily be reflected in other areas statistically
- Completely independent confirmation of the results of previous analysis is powerful evidence
|
|
Part 3(a): Just Win Baby (in Histograms)
|
- Rodman’s Win Percentage differential is even better than his Margin of Victory differential
- Specifically, his Win% differential is #1 of the 470 players who qualified for the study—by a wide margin
- Adjusting for the quality of teams Rodman played for makes his differential even better
|
- Introduce win percentage differential, which is incredibly useful for research and hypothesis-testing in many contexts
- It is harder to have a big impact on better teams
- In a game of small margins, exceptional performance in limited areas can be more valuable
|
|
Part 3(b): Rodman’s X-Factor
|
- Not only is Rodman’s Win% differential greater than his (already great) MOV differential, it is greater by one of the largest margins of any player
- After adjusting for sample size, Rodman’s X-Factor is by far the largest of any qualifying player
- The most plausible explanations for this disparity suggest that, in Rodman’s case, his Win% differential may be the more trustworthy metric
|
- “X-Factor” is the difference between MOV-predicted and actual Win% differentials
- Higher MOV’s and larger sample sizes should correspond to smaller X-Factors
- 3-D plots are a visually appealing way of identifying less-obvious outliers
- There are several plausible causes for real team and/or player X-factors
|
|
Part 3(c): Beyond Margin of Victory
|
- Using a standardized model for combining MOV and Win% differentials (which weights MOV more heavily), Rodman still places #1 in the set of 462 qualifying players (many of whom have MUCH smaller samples)
- Depending on which metric you favor, Rodman’s differentials place between the 98th percentile and the 99.98th percentile among full-time players (approximately 5% make the Hall of Fame)
|
- The statistical community over-values Margin of Victory and under-values raw winning percentages
- Winning is a provably existent skill, separate from scoring and allowing points.
- Predicting regular season win expectations is best done with a combination of Margin of Victory AND Win percentage
- The larger the sample size, the more heavily Win % should be weighted
|
|
Part 3(d): Endgame: Statistical Significance
|
- Rodman’s win differentials alone are statistically significant well beyond the 99% level of confidence.
- Looking at the overall statistical significance for player win differentials over the broadest possible pool of 1539 players, Rodman ranks between 2st and 8th, depending on your preferred metric.
- Rodman’s average ranking across metrics is second only to Shaquille O’Neal (who’s sample includes over twice as many qualifying games).
|
- Introduce “Black Box” as a term for when variance gets eaten up by events that have binary outcomes.
- Standard deviations for win differentials can be found by sampling
- These can be adjusted to different sample sizes mathematically
- Using this process, we can measure the statistical significance of individual win differentials for many players who didn’t have sufficient samples to qualify for earlier comparisons
|
|
Part 4(a): All-Hall?
|
- There are indirect reasons to believe Rodman’s Win Differential is more reliable than his Margin of Victory Differential
|
- Occam’s Razor and Bayes Theorem reasoning can make unlikely or only mildly supported independent hypotheses much more likely
|
|
Part 4(b): Rodman v. Jordan 2
|
- Rodman’s unusual consistency and otherworldly impact per possession used suggest that he may have had even more value than his Win Differentials indicate
|
- Introduce “Invisible Value” and “I-Factor”
|


 3/4(b) Rodman’s X-Factor
 3/4(c) Beyond Margin of Victory
 3/4(d) Endgame: Statistical Significance
 4/4(a): All-Hall?


Awesome, I had forgotten how much information was in the earlier posts, great series all around. What can we be expecting next?
I’m glad to see that our conversation from the firm holiday party made it into not one, but several blog posts. I wonder how Kevin Love’s stats this season — closing in on the consecutive double-double mark, leading the league in rebounding (per game and per 40) — compare to those of the Worm. Though Love’s accomplishments are pretty impressive, maybe he is just stealing rebounds from his teammates. And he sure can’t be contributing much in the win column.
Hi Eric,
I actually had a long conversation about Love at the SSAC yesterday. He definitely seems to be having a statistically rare season. The biggest problem with him is that, in the NBA, great players pretty much don’t lose ever. He’s going on his third straight season with a winrate of <30%. The only marquee players to do this in any seasons over the past 30 years are Dwyane Wade (who did it once) and Pau Gasol (twice).
Wilt was a great player, but his team set a record for losses the season he was traded to the 76ers, and about half of the losses occurred on the half-season he played for the Warriors. The 76ers soon set a record for wins in a season. Team game.
[…] Rodman owns by a large margin the highest career rebounding rate, a metric he dominated more thoroughly than Jordan did scoring. Though I’m admittedly out of my element here. Smarter people than me or Pesca have hashed out the Rodman debate, and if you fashion yourself one of these, I’d direct you to this labyrythian minefield of numbers. […]
Hi guys, new to the site. How would you respond to the assertation that RB% does not work for “role players” (can be defined as players who don’t play the most on their team) since they can expend more energy on rebounds/get more rest, etc. Rodman didn’t necessarily play the number of minutes you’d expect from an elite player; that said, he still compiled otherwordly rate-stats (RPG, RP40, etc). Do you feel RB% has this limitation?
Yes, I would say RB% is definitely affected by role, as is virtually every other stat.
[…] truly wonderful statistical analysis making a case for Dennis Rodman. One of my favorite lines: Before Rodman, we should have expected a rebounder of that quality to […]
[…] is a case for Rodman as the greatest player in NBA history. It’s worth reading it all. It has a dozen different charts, measuring different aspects of […]
[…] is being misrepresented (and have a few days to spend being entertained) go read Ben Morris’ Rodman Opus and don’t miss the bit about rebounding being […]
[…] related. His value as a baller is a great topic, and to learn more about that I direct you to a series of articles far better than anything I have ever written. This article, though, will mainly focus on […]
I’ve looked at this (but not read every single word) but how do you go from his point margin difference with and without, which is barely ahead of others, and come back with the incredible high winning %?
Basically I agree through 3A in the chart above, but then I come to a leap that I don’t get (yet)
thanks
I’m with you through 3A. How do you go from a point margin barely better than number 2 to a winning % far better than anyone else?
That’s my problem with this so far, and the leap I want to understand
thanks
The Win% differential is calculated separately using the method described. It isn’t projected based on points, it’s the actual difference in his teams’ winning percentages with and without him.
Rodman’ benefits greatly from a .381 differential from the 95 pistons, which had the 20 game minimum you used.
Had you used 21 games for your cut-off (1/4 of the season, rounded up) you would have different results.
Fair enough, but I don’t think the point is particularly probative: His differential was high with every team he played for, and can drop a data point or two and still be one of or the best ever.
I don’t have the data in front of me, but to dampen outlier seasons for whatever reason (such as age, or, incidentally, a better example is Ron Artest, whose suspension after the “Malice in the Palace” coincided with many team-mates and inflates his career differential substantially), I tried dropping each player’s “best” and “worst” impact years, and it had little effect that would be relevant to this analysis (aside from dramatically shrinking the pool of qualifying players).
You also get MJ who has only one qualifying season – 2002 Washington after 2 retirements where is differential is still .182.
His return season 1995 had 17 games and he had a differential of .242 – if I weight those 2 you get .208 – and neither season was his peak.
This is such a cherry picking exercise that it doesn’t really mean a lot.
Meh, you have to draw a line somewhere. I was acutely aware of the fact that adjusting the filters a small amount one way or another would include or exclude certain players and/or be more or less favorable to them. So I tried to set lines that were general, rationalizable on their own terms, and as effective and probative as possible with my particular goal in mind: evaluating Dennis Rodman. There’s a constant trade-off between breadth and accuracy, and I went with a balance that I thought best for testing my hypothesis about Rodman having HOF-level value.
If you read the last post in this series, you know that I agree MJ’s Win % diff is probably higher than Rodman’s (though, given sample sizes, it is not more statistically significant). I have also noted in several different places that I think Rodman has certain advantages in these comparisons: For example, he missed a relatively high percentage of games due to suspension rather than injury, and he didn’t stay around in the league several years past his prime as many other great players did. But the fact that there are large margins of error is offset by Rodman’s statistically extreme performance. The whole point of showing that he comes out on top in this reasonably broad pool of players isn’t to show that he is actually the best, but to show how unlikely it is that he wasn’t very very good.
well put statement. Good job
I’m not impressed.
In the “Outlier in motion” graph, Rodman seems to make a huge statistical leap in rebounding prowess between the 1990 and 1991 season. What’s happening there? Did his MOV or win% diff also change noticeably (assuming we have a large enough sample size)?
If we’re looking for the bizarre loophole, maybe looking at other examples of large statistical leaps from year to year+1 would yield worthwhile insights.
I also wonder if Rodman can recall any conscious change in his approach or strategy for games during those years. Worth asking him before he gets locked away in North Korea? :)
[…] women’s hard-court players over 30 so small sample sizes and all that, but it’s still a Rodman-esque level of […]
[…] didn’t come up with 99% of this section. This guy convinced me that Rodman is one of the most unique players of all time – and that makes him one […]
[…] Morris used statistics to assess the value of Dennis Rodman as a rebounder and as a basketball player in general – and wrote one of the most epic series of blog posts in sports analytics. […]
[…] Rodman was a much better rebounder and defender than the next best player in history, even if he wasn’t a primary scorer that made him productive, which makes him the best player to construct a team – even when accounting for the fact that rebounding is only about a quarter of the game in basketball, he was so much better than the next best rebounder in history than Jordan was better than the next best scorer, it means that my team is more likely to win, even with my friend picking the GOAT Jordan with pick 2. […]
As probably the only Brazilian that is an NBA fan AND graduated in Statistics, I really thank for this article.
[…] dominated by a single player. The incredibly innovative Benjamin Morris (again…) proved this in his epic defense of Dennis Rodman as possibly the greatest player of all time (no […]
[…] afford to not have Draymond on our team. He brings so much to the table, and looking back to Morris’ defense of Rodman, Green might just be in the top-5 “third best” players in […]
[…] a series of 12 posts on his blog, Morris made what he termed “The Case for Dennis Rodman”. You should read the whole thing—it’s fascinating, even seven years later. He began by stating […]
[…] a series of 12 posts on his blog, Morris made what he termed “The Case for Dennis Rodman”. You should read the whole thing—it’s fascinating, even seven years later. He began by stating […]
[…] Indeed, when considering Curry’s potential, I think Rodman is perhaps an even more important precedent than Chamberlain or Michael Jordan. Rodman came into the league as a reasonably well-rounded player but had an incredible talent for rebounding. As years went by, his teams leaned on this skill more and more. He took on fewer and fewer offensive responsibilities, and he started gathering larger and larger shares of his team’s rebounds. In the 1993-94 season, he gathered nearly 29.7 percent of all available rebounds — at the time, the highest by any other player was Moses Malone, with 23.4 percent in 1976-77. Despite being one of the most one-dimensional players ever, this made Rodman one of the most valuable players in NBA history. […]
[…] Indeed, when considering Curry’s potential, I think Rodman is perhaps an even more important precedent than Chamberlain or Michael Jordan. Rodman came into the league as a reasonably well-rounded player but had an incredible talent for rebounding. As years went by, his teams leaned on this skill more and more. He took on fewer and fewer offensive responsibilities, and he started gathering larger and larger shares of his team’s rebounds. In the 1993-94 season, he gathered nearly 29.7 percent of all available rebounds — at the time, the highest by any other player was Moses Malone, with 23.4 percent in 1976-77. Despite being one of the most one-dimensional players ever, this made Rodman one of the most valuable players in NBA history. […]
[…] Benjamin Morris – My first introduction to high-level analytics, and the author of the oddly convincing case for Dennis Rodman’s greatness […]
[…] like no one has since. 538 writer Ben Morris gained notoriety in NBA analytics circles for his large treatise on just how amazing Dennis Rodman was, and it took many many words to explain!Sadly, Dennis Rodman is not even the most egregious aspect […]
[…] סדרה של 12 פוסטים בבלוג שלו. מוריס עשה את מה שהוא כינה "המקרה של דניס רודמן". עליכם לקרוא את הכל – זה מרתק. אפילו שבע שנים מאוחר […]
[…] 2. The case for Dennis Rodman. […]
[…] View Reddit by Steve_McKinnon – View Source […]
[…] points me to this by Benjamin […]
Loved this article. Bottom line seems to be that Rodman tilted the possession balance in a consistent and extreme way. So being on teams that could exploit those increased opportunities magnified his value. Without being on two of the historically best teams in NBA history, we might not have seen the synergy to such a degree, but it still would have been pretty amazing. The analogy to the defensive prowess of the 2019 Raptors is obvious. Four stops / changes of possession a game equals a fairly consistent 4-8 point swing.