One of the great false myths in basketball lore is that Wilt Chamberlain and Bill Russell were Rebounding Gods who will never be equaled, and that dominant rebounders like Dennis Rodman should count their blessings that they got to play in a era without those two deities on the court. This myth is so pervasive that it is almost universally referenced as a devastating caveat whenever sports commentators and columnists discuss Rodman’s rebounding prowess. In this section, I will attempt to put that caveat to death forever.
The less informed version of the “Chamberlain/Russell Caveat” (CRC for short) typically goes something like this: “Rodman led the league in rebounding 7 times, making him the greatest re bounder of his era, even though his numbers come nowhere near those of Chamberlain and Russell.” It is true that, barring some dramatic change in the way the game is played, Chamberlain’s record of 27.2 rebounds per game, set in the 1960-61 season, will stand forever. This is because, due to the fast pace and terrible shooting, the typical game in 1960-61 featured an average of 147 rebounding opportunities. During Rodman’s 7-year reign as NBA rebounding champion (from 1991-92 through 1997-98), the typical game featured just 84 rebounding opportunities. Without further inquiry, this difference alone means that Chamberlain’s record 27.2 rpg would roughly translate to 15.4 in Rodman’s era – over a full rebound less than Rodman’s ~16.7 rpg average over that span.
The slightly more informed (though equally wrong) version of the CRC is a plea of ignorance, like so: “Rodman has the top 7 rebounding percentages since the NBA started to keep the necessary statistics in 1970. Unfortunately, there is no game-by-game or individual opponent data prior to this, so it is impossible to tell whether Rodman was as good as Russell or Chamberlain” (this point also comes in many degrees of snarky, like, “I’ll bet Bill and Wilt would have something to say about that!!!”). We may not have the necessary data to calculate Russell and Chamberlain’s rebounding rates, either directly or indirectly. But, as I will demonstrate, there are quite simple and extremely accurate ways to estimate these figures within very tight ranges (which happen to come nowhere close to Dennis Rodman).
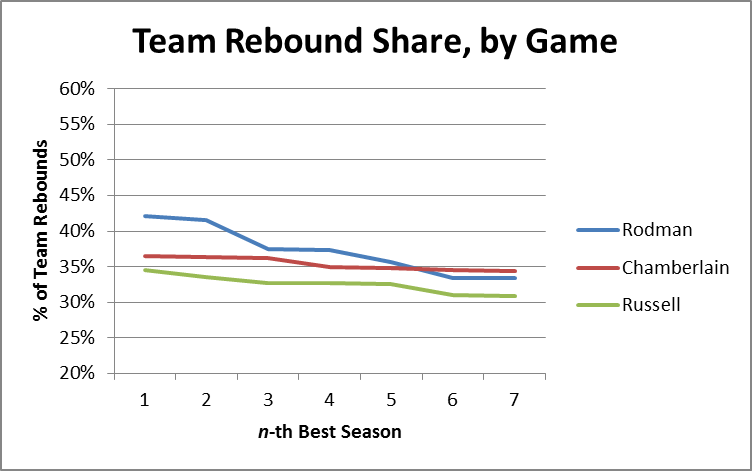
Before getting into rebounding percentages, however, let’s start with another way of comparing overall rebounding performance: Team Rebound Shares. Simply put, this metric is the percentage of team rebounds that were gotten by the player in question. This can be done for whole seasons, or it can be approximated over smaller periods, such as per-game or per-minute, even if you don’t have game-by-game data. For example, to roughly calculate the stat on a per-game basis, you can simply take a player’s total share of rebounds (their total rebounds/team’s total rebounds), and divide by the percentage of games they played (player gms/team gms). I’ve done this for all of Rodman, Russell and Chamberlain’s seasons, and organized the results as follows:
As we can see, Rodman does reasonably well in this metric, still holding the top 4 seasons and having a better average through 7. This itself is impressive, considering Rodman averaged about 35 minutes per game and Wilt frequently averaged close to 48.
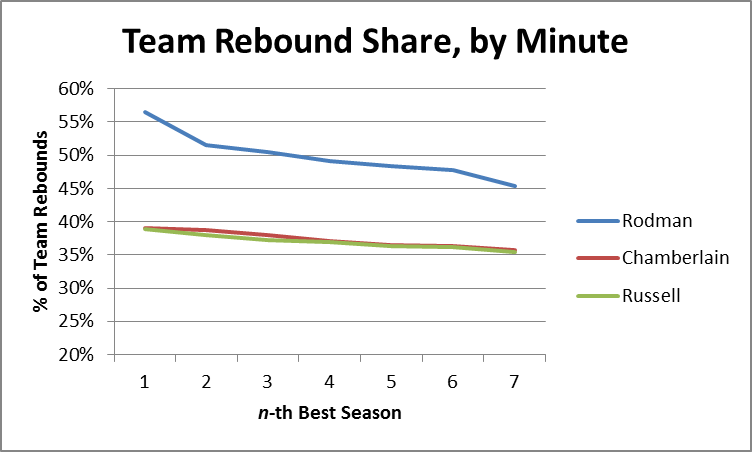
I should note, in Chamberlain’s favor, that one of the problems I have with PER and its relatives is that they don’t give enough credit for being able to contribute extra minutes, as Wilt obviously could. However, since here I’m interested more in each player’s rebounding ability than in their overall value, I will use the same equation as above (plus dividing by 5, corresponding to the maximum minutes for each player) to break the team rebounding shares down by minute:
This is obviously where Rodman separates himself from the field, even pulling in >50% of his team’s rebounds in 3 different seasons. Of course, this only tells us what it tells us, and we’re looking for something else: Total Rebounding percentage. Thus, the question naturally arises: how predictive of TRB% are “minute-based team rebound shares”?
In order to answer this question, I created a slightly larger data-set, by compiling relevant full-season statistics from the careers of Dennis Rodman, Dwight Howard, Tim Duncan, David Robinson, and Hakeem Olajuwon (60 seasons overall). I picked these names to represent top-level rebounders in a variety of different situations (and though these are somewhat arbitrary, this analysis doesn’t require a large sample). I then calculated TRS by minute for each season and divided by 2 — roughly corresponding to the player’s share against 10 players instead of 5. Thus, all combined, my predictive variable is determined as follows:
Note that this formula may have flaws as an independent metric, but if it’s predictive enough of the metric we really care about — Total Rebound % — those no longer matter. To that end, I ran a linear regression in Excel comparing this new variable to the actual values for TRB%, with the following output:
If you don’t know how to read this, don’t sweat it. The “R Square” of .98 pretty much means that our variable is almost perfectly predictive of TRB%. The two numbers under “Coefficients” tell us the formula we should use to make predictions based on our variable:
Putting the two equations together, we have a model that predicts a player’s rebound percentage based on 4 inputs:
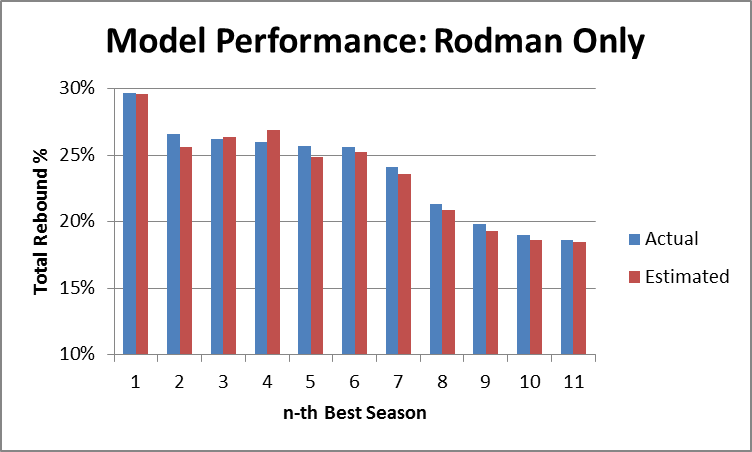
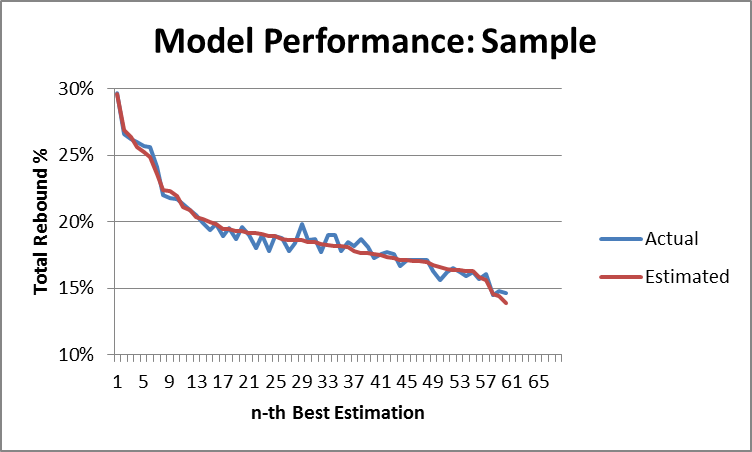
Now again, if you’re familiar with regression output, you can probably already see that this model is extremely accurate. But to demonstrate that fact, I’ve created two graphs that compare the predicted values with actual values, first for Dennis Rodman alone:
And then for the full sample:
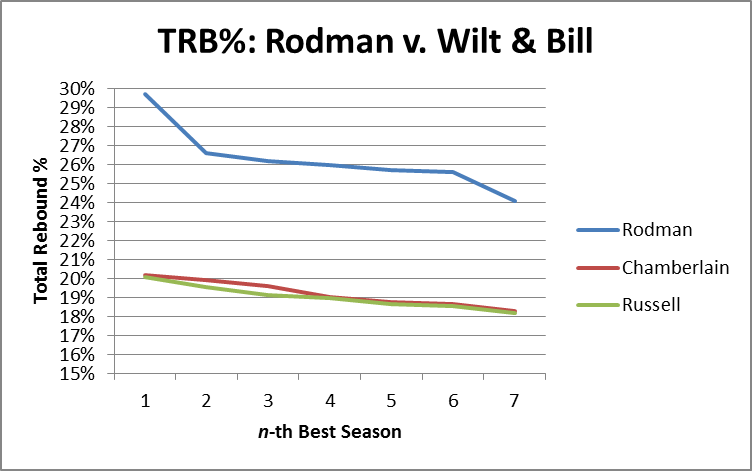
So, the model seems solid. The next step is obviously to calculate the predicted total rebound percentages for each of Wilt Chamberlain and Bill Russell’s seasons. After this, I selected the top 7 seasons for each of the three players and put them on one graph (Chamberlain and Russell’s estimates vs. Rodman’s actuals):
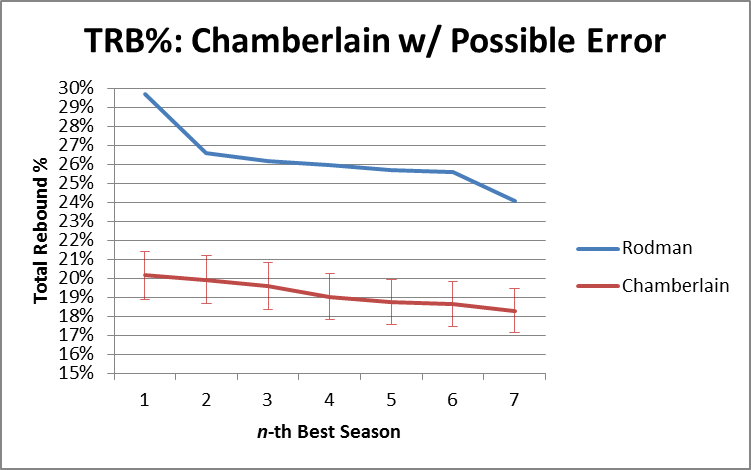
It’s not even close. It’s so not close, in fact, that our model could be way off and it still wouldn’t be close. For the next two graphs, I’ve added error bars to the estimation lines that are equal to the single worst prediction from our entire sample (which was a 1.21% error, or 6.4% of the underlying number): [I should add a technical note, that the actual expected error should be slightly higher when applied to “outside” situations, since the coefficients for this model were “extracted” from the same data that I tested the model on. Fortunately, that degree of precision is not necessary for our purposes here.] First Rodman vs. Chamberlain:
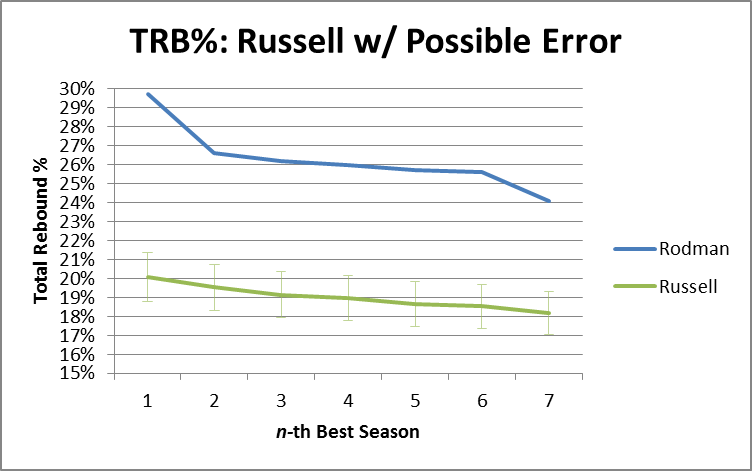
Then Rodman vs. Russell:
In other words, if the model were as inaccurate in Russell and Chamberlain’s favor as it was for the worst data point in our data set, they would still be crushed. In fact, over these top 7 seasons, Rodman beats R&C by an average of 7.2%, so if the model understated their actual TRB% every season by 5 times as much as the largest single-season understatement in our sample, Rodman would still be ahead [edit: I’ve just noticed that Pro Basketball Reference has a TRB% listed for each of Chamberlain’s last 3 seasons. FWIW, this model under-predicts one by about 1%, over-predicts one by about 1%, and gets the third almost on the money (off by .1%)].
To stick one last dagger in CRC’s heart, I should note that this model predicts that Chamberlain’s best TRB% season would have been around 20.16%, which would rank 67th on the all-time list. Russell’s best of 20.08 would rank 72nd. Arbitrarily giving them 2% for the benefit of the doubt, their best seasons would still rank 22nd and 24th respectively.

I think youre statistical work is very impressive and the most compelling evidence I’ve seen for Rodman being selected to the hall of fame. Later in your series, I wonder if it would be able to compare his impact vs other Hall of Fame members (if you didn’t already plan to do so).
You had me up until “Chamberlain’s best TRB% season would have been around 20.16%, which would rank 67th on the all-time list. ” By all accounts Chamberlain and Russell were outstanding rebounders. However, your model (if I can call it that) only says that they were pretty good rebounders. Chamberlain and Russell’s best seasons should be in the top 20. That doesn’t pass the smell test to me. Either there’s something wrong with your model, or [estimated] TRB% isn’t a good measure of rebounding ability.
I can’t say much for “all accounts,” as I don’t really know where those accounts come from aside from what I’ve already outlined. I understand that the accepted historical narrative says that they were the all-time great rebounders, and there is some room for error in my “model” (which is only misleading in the sense that this method of approximation is probably far more accurate than “models” usually are). But there’s really not enough room for error for the narrative to be right.
As a logical matter, you are correct that the problem could be with TRB% as the measure — it is theoretically possible that you could have a high TRB% and not help your team get extra rebounds overall, or vice versa. I can’t say for certain that this is *not* the case w/r/t Chamberlain and Russell — it is a possibility. However, I *can* say that I have no reason to believe this *is* what’s going on with these two, any more than it could be going on with anyone else’s numbers—and the “all accounts” you refer to aren’t meaningfully probative, considering those “accounts” almost certainly exist because of the rebounding totals that seem monstrously high by today’s standards.
The problem with your “smell test” is that everything from Chamberlain and Russell’s era tends to smell like mothballs without advanced metrics. One major goal of statistical analysis is to separate hard data from the delusions of the senses. After all, Blake Griffin’s dunks may knock the fillings out of your teeth even when you watch them on television, but they still only count for as many points as an awkward Sasha Vujacic layup. Chamberlain and Russell may have been great rebounders “by all accounts”, but we’re not interested in narrative or perception here. Here, we get to the heart of the matter, which is that Chamberlain and Russell were outstanding rebounders in their day, but if Dennis Rodman had been born a few decades earlier, their “smell test” might have registered as reheated meatloaf rather than prime rib and lobster.
Another possible explanation might claim that the high pace the offensive-defensive trade-off was more extreme back than, so regardless of their ability the actual rebounding chances of players of the time were much lower (there were less players near the basket, basically). This is only a wild speculation, of course. It falls under the category of “something wrong with TRB%”. I have no reason to believe it’s true, however.
I’ve thought about this too. Basically, it’s possible that the faster pace led to a more even distribution of rebounds, as could a relatively smaller degree of specialization. If the gap between Rodman and Wilt/Bill were smaller I’d worry about it more. On the other side, those guys also played before the 3-pointer, and rebounds off of 3 point shots might (one would speculate) also be more unpredictable. I haven’t tested that though.
First and foremost, this data doesn’t take into account that the NBA didn’t even COUNT offensive rebounds until 1973; the year AFTER Wilt retired. Had offensive rebounds been statistically included (We won’t even bring up blocked shots, also not tabulated until after Wilt’s retirement) in the box scores for the length of Wilt’s career, it is entirely possible that nobody else’s name would appear on any rebounding list.
Secondly, the writer fails to include the fact that for the 1971/1972 NBA season – fully ten years after the math model – at 36 years of age – Wilt AVERAGED 19.2 RPG during the regular season and in the Finals against the Knicks, bumped that up to 21.0 rebounds per game for the series..
Another aspect ignored in this model, is a head-to-head scenario. In designing Rodman vs. Wilt “data” one of the most basic of fundamentals in the game of basketball needs to be strongly considered: Blocking out the opposition.
The author seems to be assuming that Rodman would be able to get into position, near the basket, to get a rebound; against Wilt or Russell. If Rodman were Wilt’s defensive assignment, Dennis would have been fortunate to even touch the ball; I saw both play.
And lastly, Rodman’s role was rebounds and defense; he couldn’t be asked for anything more. Clearly, the author has never played the game at a high level, and certainly never saw Chamberlain play. To quote, you’re right: “Not even close”
1. The NBA counted offensive rebounds, they just didn’t make a distinction between offensive and defensive rebounds.
2. Even if you were right (which you most definitely are not), it wouldn’t significantly impact the model, since it is predicting rebound *percentage* based on a *percentage* of team rebounds collected. If offensive rebounds didn’t count (which, again, THEY DID), they wouldn’t count for the team either.
3. Yes, if Rodman and Wilt played in the same game, I would expect Rodman to average more rebounds.
4. I have no problem with snark, except when It’s a substitute for actual arguments. I do moderate for content, so please keep comments and rhetoric on-topic.
Owned.
One more thing I’d like to ask the author: How many rebounds – on either end of the floor – do you think Rodman would get against either Chamberlain or Russell?
Sorry, but your model is too crude. Rodman was a remarkable rebounder, but not all rebounds are the same. In particular, Chamberlain and Rodman acquired rebounds in very different ways (with Russell getting his in a somewhat intermediate fashion, but rather more in the style of Chamberlain). The former seized prime (mainly defensive) rebounding real estate and controlled it, while Rodman swept large areas of less densely rewarding court. The latter is more energy intensive, per rebound, and I do not believe his burn rate could be maintained in the more frenetic game of the earlier era. Now, there is considerable room for his percentage to drop and for his RPM to still top Chamberlain/Russell, but its more than unlikely that his rebounds would increase in direct proportion to either rebounds available or minutes played. You always have to be careful with linear projections. Rodman had a remarkably live body, however, and might have pulled it off for spurts, which isn’t bad. I have no firm convictions as to exactly how Wilt or Bill would have performed as rebounders in Rodman’s era, other than quite well.
Sorry, I didn’t catch this comment until now.
It is interesting, though very speculative. There is something to your observation that Rodman cleaned up large areas of the court, though in many ways I think this made his rebounding more energy-efficient. Rather than burning his energy battling to get a slightly better percentage of “hard” rebounds, he stepped into empty spaces to get a *much* better percentage of “easy” rebounds. The ball/player tracking study presented at last year’s Sloan conference lends some ancillary support to this theory, finding that proximate player density is the most predictive variable for who is most likely to grab a rebound. This suggests to me that a space-based rebounding strategy may be optimal.
As for transporting players backwards or forwards in time, that’s a metaphysical problem at the heart of all multi-era sports debates. There are a lot of ways to go, but I think there’s a certain necessary “suspension of disbelief” that we engage in whenever we argue that any player from a previous era was “better” than one from a later one, because the likely reality that our childhood heroes would be underdogs against today’s bench-warmers is untenable.
“…because the likely reality that our childhood heroes would be underdogs against today’s bench-warmers is untenable.” By “untenable” you meant “unendurable”? And you’re suggesting that Wilt and Russell “would [likely] be underdogs against today’s bench-warmers”? Seriously?
No, Rodman’s rebounds were not more energy-efficient than Wilt’s. He didn’t “step” into empty spaces to get easy rebounds, he got his extra rebounds by chasing them energetically. I guarantee that he invested more energy in each rebound than Wilt. If the opportunities were there, could Rodman do it as many times a game as Wilt actually did it? Even if he played 48 despite his offensive limitations, headcase issues, and comparative problem with fouls? I’m not convinced.
On the other hand, the rebounds thus obtained may have more often been “extra” rebounds, that Rodman’s team would not otherwise have gained. A higher percentage of Wilt’s rebounds came to him because he was playing center, not forward. Also, Wilt had more opportunities, even proportionately, to collect free throw misses. For much of his career fouls that would later result in the ball being taken out of bounds were one-shot fouls. (On the other hand, I think I recall Wilt was often excused from rebounding opponents free throws, iirc.)
On the other hand, a Wilt offensive rebound was on average a more valuable thing than a Rodman offensive rebound.
I repeat, your model is too crude. Boxscore numbers give insights, but don’t capture enough, particularly when the question is somewhat ill defined.
And when the game was different. 1960’s shooting wasn’t “terrible”. It was lower percentage. But that was largely because you couldn’t run with the ball after picking up your dribble, which itself couldn’t be so clearly a carry, nor hop onto two feet to take your shot without dribbling at all. There was a reason why rushing up and getting a shot off before a defense could set up was emphasized and effective — defenses had more latitude to impose contact. Your point that the lower percentages contributed to more rebounds is correct, but there are other reasons for higher percentages now than better shooters.
On further thought… the greater availability of free throw misses would increase Wilt’s gross rebound total, but might decrease his fraction of rebounds, as there would be little room on free throw misses for his comparative advantage to have an effect.
PLEASE READ
Hey I really like the blog, and found this section very interesting but a bit of research and knowledge of basketball history and you would realize how wrong you are in certain parts.
First off, in your Rodman vs. Ancient History the model is completely wrong because TEAM REBOUNDS were kept into league averages until the 1968-69 season, thus inflating the number of rebounds available per game in comparison to the 1980s/90s in which Dennis Rodman played.
For instance: I will find the sum rebounds for the players in 1963 (Wilt’s best RPG year after team rebounds are taken out of the equation – I don’t think it is the best one for REB% because his MPG were also high for that year.)
1963 Warriors Rebounds (with team rebounds): 5359
1963 Warriors Rebounds (without team rebounds): 4670
Wow that is a big difference! Remember, during Rodman’s time (he played after 1967-68) the league didn’t count these team rebounds into their averages. I actually found data for EVERY YEAR (both regular season and playoffs) Wilt and Rodman played in the team rebounds category and put them all to the base year of 1996 (thus comparing them on equal footing) and this is how it pans out.
Wilt Regular season:
1959-60 17.4
1960-61 17.4
1961-62 17.2
1962-63 17.5
1963-64 15.8
1964-65 16.0
1965-66 16.9
1966-67 16.8
1967-68 17.0
1968-69 15.3
1969-70 14.4
1970-71 14.2
1971-72 15.5
1972-73 15.2
AVG: 16.29
PER36: 12.81
Rodman Regular Season:
1986-87 4.0
1987-88 8.3
1988-89 8.8
1989-90 9.3
1990-91 11.9
1991-92 17.7
1992-93 17.5
1993-94 16.6
1994-95 16.7
1995-96 14.9
1996-97 16.2
1997-98 14.9
1998-99 11.1
1999-00 13.8
AVG: 12.71
PER36: 14.43
Rodman is still clearly ahead, of course there are reasons for that. Blatant stat-padding such as ripping rebounds out of teammates hands, not boxing out his man and going to the side he felt the ball would go to, missing layups and tip ins on purpose, aborting the offense, not coming on help defense and grabbing every end of quarter heave and free throw miss that he could. I’m not saying its never been done before, but it gives a good idea why he is such an outlier in the regular season and why he is only second in REB% in the playoffs.
Here are some quotes to back up this stat padding mentality that he had:
“I let Dennis Rodman get his rebounds and get out of his way . . . allow him to pad his rebound stats,” Pippen said. “I think, as a basketball team, we just have to get more hungry. Dennis is going to get his rebounds. I just have to be more aggressive and get mine as well. We need to go out to win and not go out for the stats.”
http://articles.chicagotribune.com/1996-12-13/sports/9612130108_1_bulls-scottie-pippen-dennis-rodman
“Dennis is going to get that basketball at the cost of pulling it away from his teammate sometimes” – Phil Jackson
“It’s a passion for him, but sometimes a distraction,” Jackson says. “It borders on an obsession that can create an obstruction to a team. We always have to temper him as still being a part of the offense, even though you’re still doing your job–which is going to get rebounds. There are times when I’ve seen Dennis step from one side of the basket where his man is because the shot is there and he can get the high-percentage rebound. But the ball bounces right to his man for a layup. His instinct is to go to the high-percentage side to get that rebound.”
http://articles.chicagotribune.com/1996-02-29/sports/9602290143_1_bulls-coach-phil-jackson-dennis-rodman-grab
“I mean, there are times when we’re fighting against him to get rebounds. Sometimes we’ll lose it out of bounds because we’re fighting him.” – Michael Jordan
From “In the Year of the Bull” by Rick Telander p212
(This is an article on how stat keeping is superstar-biased, not sure how accurate it is, but have a look at it)
Alex says, “is if a shot goes up and someone tips it and someone else recovers it, you can give it to either one. Rodman would get those all the time. Most callers will give it to the guy who actually gets possession. But that doesn’t mean a caller can’t give it to someone in a scrum who tipped it. What if Byron Scott retrieves it? Byron Scott doesn’t need the rebound.”
http://deadspin.com/5345287/the-confessions-of-an-nba-scorekeeper
I could find more, but you get the point. Much (but not all) of this was removed in the playoffs. How does Rodman stack up now?
Wilt playoffs:
1959-60 16.8
1960-61 14.9
1961-62 17.7
1963-64 18.1
1964-65 19.0
1965-66 21.7
1966-67 19.4
1967-68 18.1
1968-69 18.1
1969-70 17.2
1970-71 16.2
1971-72 17.1
1972-73 18.8
AVG: 17.97
PER36: 13.71
Rodman playoffs:
1986-87 4.6
1987-88 5.8
1988-89 9.6
1989-90 8.4
1990-91 12.0
1991-92 10.4
1993-94 15.8
1994-95 15.2
1995-96 14.4
1996-97 8.6
1997-98 12.4
AVG: 10.06
PER36: 12.80
WOW! Wilt Per36 minutes was actually a better rebounder than Dennis Rodman for his playoffs career! Rodman still might be a better rebounder some years than Wilt and still this isn’t quite as accurate as REB% but its still puts EVERYTHING in perspective. Especially since Wilt eclipses Rodman in nearly every facet of the game itself. Wilt even played 4 playoffs (where many of his games were played) after a career threatening injury.
This is only one of your arguments though, I can go on into more things like:
“There are a lot of ways to go, but I think there’s a certain necessary “suspension of disbelief” that we engage in whenever we argue that any player from a previous era was “better” than one from a later one, because the likely reality that our childhood heroes would be underdogs against today’s bench-warmers is untenable.”
And break it down why you are wrong. I can’t imagine Wilt the decathlete, the strongest man to play in the NBA, the high jumper having any problems against any centers, let alone bench warmers in todays game. Watch this just for some basics: http://www.youtube.com/watch?v=z4WZXiaDzyc
Anyways, your article was very interesting, and in fact made me want to delve into basketball statistics myself. You can email me at [email protected] for more information like this. Thanks.
Thanks for the detailed response. I admit I am unfamiliar with the “Team Rebound” issue. If you’d like to write it up with some more detail and references, I might consider looking into it for a future “Case Against the Case For Dennis Rodman” post. [Added to clarify: I mean if you want to write something up and email it to me, I might be inclined to publish it alongside any response I might have (if it checks out). If you decide to email me, just comment here to let me know when you do, otherwise it’s likely to get filtered.]
As for the subjective claims that Rodman took rebounds from his teammates, I find them fairly non-germane. I address the ways he may have padded his rebound stats many times later in the series, indeed finding it likely that there was some artificial inflation, though also concluding that it doesn’t affect the bottom line.
Anything ever come of this? I’m curious if Nolan was right about the “team rebound” stat, and, if so, to what extent it affects the accuracy of this installment of your educational Rodman series.
Ah! I forgot to fill out the spam protection and lost most of my response. However you should receive a similiar email in about 30 minutes. Thanks.
Got it, thanks.
I hope you don’t misinterpret the “new commenter saying how awesome this is” as smoke, but I’m a new commenter, and this is just a phenomenal piece. I’m three entries in, and am learning a lot and really enjoying myself at the time — win, win.
But I had an observation/criticism/question. A couple of times so far, I notice that you will take non-random sub-samples of your data at the player level and then use that sub-sample for further analysis. In this post, it’s when you created the PV statistic based on five players — “Dennis Rodman, Dwight Howard, Tim Duncan, David Robinson, and Hakeem Olajuwon” to create a 60 season sub-sample. Why these? You write, “I picked these names to represent top-level rebounders in a variety of different situations (and though these are somewhat arbitrary, this analysis doesn’t require a large sample).”
My concern is that you are introducing spurious correlation between rebounding, time on the court, and overall shot accuracy (team share rebounding) because of the “conditioning on a collider” problem. (You’ve no doubt seen this nice explanation of it by Gabriel Rossman but if not, it’s great and I use it now in my causal inference class every semester).
Here’s my graphical representation of the problem.
1. f(M,A,R) –> S
2. g(M,A) –> R
Where “R” is the player’s rebounding rate, “M” is number of minutes on the court in a game, “A” is the overall accuracy of players taking shots, “f” is a function that determines “top-level rebounders in a variety of different situations and “g” relates minutes and accuracy to rebounding itself. The “S” variable is the sample of five players, or the “top-level rebounders in a variety of different situations”.
So notice, while there is some joint correlation between M and A and R, which needs to be adjusted for so that some pure measure of R can be determined which conditions on those omitted variables, you are conditioning on top R individuals. Therefore you are conditioning on low A (player inaccurate shooting) and high M (minutes in the game) values.
I’m not exactly sure what to expect from this, except that if you draw out these two equations using a directed acyclical graphical model (DAG), you’ll see that when you condition on the sub-sample, you will have opened a backdoor path between R, A and M which is equivalent to introducing spurious correlations across these variables. I’m not sure we can say either that in doing so that you are preserving the ordering that you’re trying to model. Your PV variable is the ratio of (Player rebounds per team rebounds) and (Player minutes per team minutes).
Maybe you’re fine, but I worry that this non-random selection still is not very transparent and at least raises some red flags. I wonder if you shouldn’t just do this for the entire sample and not a sub sample — particularly not a sub sample that is conditioning on the dependent variables of interest (R in this case).
Hi Scott, thanks for the response.
The non-random selection for that “quick and dirty” model was entirely a function of me having to cut and paste data from basketball-reference at the time. I agree that it’s bad practice and would never do it these days (and you’ll see, later in the series, I move toward more “entire history of the league” datasets).
However, the margin for error for this analysis is so huge that I think the particular model is incidental and is provided mainly as an example of how estimating old RB%’s isn’t nearly as difficult as people make it out to be. In reality, any reasonable method you use to compare Rodman with Chamberlain and Russell will tell you the same thing: Rodman grabbed a much higher % of his available rebounds, and it’s not close.
All these graphical stats are bunch a baloney! Granted Dennis Rodman was a good rebounder, he is not in the same class as Wilt Chamberlain. If you are not asked to score and just stand around the basket to grab rebounds, who wouldn’t average 16 rebounds per game? If Charles Barkley didn’t average 20 points a game and was asked to just rebound, he would’ve averaged 20 rebounds per game.
so don’t make these stupid analytical comparisons! The same goes for Bill Russell too. People who say Russell is better than Chamberlain are all crazy! He is just another Dikembe Mutombo on a championship team. If Wilt was on that team, they would’ve won same amount of championships. Russell and Rodman are just one dimensional players. If Michael Jordan didn’t retire for 2 years, he would’ve won 8 championship in a row. That is why he is the greatest player of all time.
You make some great points about Rodman. However, as one commenter pointed out, Rodman’s role was solely as a rebounder/defender. He had no scoring responsibilities, unlike Chamberlain, who was rebounding AND scoring 30-50 points a game. Not least, you fail to consider the sheer stamina it takes to pull down 26 rebounds a game, not to mention being your teams primary scoring option at 50 ppg. I guarantee, if Chamberlain was only rebounding, he would have averaged 35 rebounds per game, easy. Even Barkley or Moses Malone would have been better rebounders than Rodman if they focused primarily on that. No knock on Rodman, but your analysis fails to account for all variables.
Very interesting read. I am not statistically inclined, given that I tend to treat most exercises in mathematics as slightly less toxic than an envelope of anthrax; so I don’t get much out of the deeply analytical portions that delve into the purposes and weaknesses of certain modalities and equations. However, I overall completely agree with the underlying thesis and am pleased to find an intelligent source championing one of my own favorite pillboxes: that Dennis Rodman was a much better basketball player than he give him credit for.
I do not find Wilt’s rebounding stats to be all that impressive, because statistics rarely impress me more than overall performance, which is to say, winning basketball games at the highest level, especially championships – since that’s the entire point of playing in the NBA anyway. I cannot speak with any experience about the affect of Chamberlain’s rebounds upon a game, but I can say from experience that Dennis Rodman was the only player I have ever seen who could completely dominate a game with only his rebounds – as he did against the Sonics in the 1996 Finals.
My other favorite pillbox, aside from the one that I keep in my kitchen and upon which I occasionally stand to reach the cookies thereupon, is the fact that Scottie Pippen was a lot better at basketball than most people seem to remember; but since the majority of his greatest strengths lay on the defensive end – for which there is still sadly only limited means of measuring statistically – it is a much harder one to prove.
You can run all the analytics you want to try and prove little 6 foot 7 Dennis Rodman would out rebound 7 foot 1 Wilt Chamberlain. If you ever watched Rodman rebound, he got most of them with hustle, tipping the basketball time and time again until he could secure it. That don’t work with Chamberlain.
If you watch video of WIlt, you’d see that Chamberlain usually got his rebounds above the rim by jumping straight up and grabbing the basketball with both hands while it was still out of reach of the other players.
Chamberlain had a vertical of at least 45 inches and reach of 13 feet 3 inches. That’s 3 inches higher than the top of the backboard. His goal was to grab rebounds when the ball was high, out of the reach of opponents. When Wilt went for a rebound, he almost always does so by jumping straight up and securing the ball with two hands. Just Google “Chamberlain rebounding” and the photos don’t lie.
On most rebounds, Wilt Chamberlain would already have the ball firmly secured in both hands before it got low enough for Dennis Rodman to touch.
Look at Rodman’s rebounds. EVERY TIME he goes to secure the ball, the basketball is well below the rim. It is impossible to find an example of him securing a rebound while the ball is still above the rim. Rodman was a “tipper”. He got his rebounds thru hustle and effort, not leaping ability.
If Rodman can’t touch it, Rodman can’t tip it. If Rodman can’t tip it, Rodman ain’t rebounding it.
WILT CHAMBERLAIN WINS THIS ONE AND IT AIN’T EVEN CLOSE!!!
Wilt Chamberlain Archive estimated his vertical around 41″.
Google Archives either used 12’9 as his best reach: https://m.youtube.com/watch?feature=youtu.be&v=0EpVZS26BUs
Wilt Chamberlain was an incredible athlete. No doubt about it.
How he got the rebounds is completely irrelevant. All that matters is that he got them, and he did it in a league that was taller, more athletic, and more skilled than Wilt’s.
In Rodman’s best rebounding season, he had 29.7% TRB%, and was in a league with an average center height of 6’11.6″ and PF height of 6’9.1″, and players were more athletic on average.
In Wilt’s best rebounding season, he had 20.2% TRB%, and was in a league with an average center height of 6’9.8″ and PF height of 6’7.7″, and players were less athletic on average.
I’m not sure how you could read that and still think Wilt was the better rebounder. If he was such an amazing rebounder and would’ve had a huge advantage over Rodman due to his amazing vertical, why did he only manage 20% TRB% at his peak vs. a bunch of less athletic shorties? And why is the guy who owns the stat all-time 6’7″? Gee, maybe it’s because…wait for it…there’s a lot more to rebounding than simply how tall you are and how high you can jump.