In this post I will be continuing my analysis of just how dominant Dennis Rodman’s rebounding was. Subsequently, section (c) will cover my analysis of Wilt Chamberlain and Bill Russell, and Part 2 of the series will begin the process of evaluating Rodman’s worth overall.
For today’s analysis, I will be examining a particularly remarkable aspect of Rodman’s rebounding: his ability to dominate the boards on both ends of the court. I believe this at least partially gets at a common anti-Rodman argument: that his rebounding statistics should be discounted because he concentrated on rebounding to the exclusion of all else. This position was publicly articulated by Charles Barkley back when they were both still playing, with Charles claiming that he could also get 18+ rebounds every night if he wanted to. Now that may be true, and it’s possible that Rodman would have been an even better player if he had been more well-rounded, but one thing I am fairly certain of is that Barkley could not have gotten as many rebounds as Rodman the same way that Rodman did.
The key point here is that, normally, you can be a great offensive rebounder, or you can be a great defensive rebounder, but it’s very hard to be both. Unless you’re Dennis Rodman:
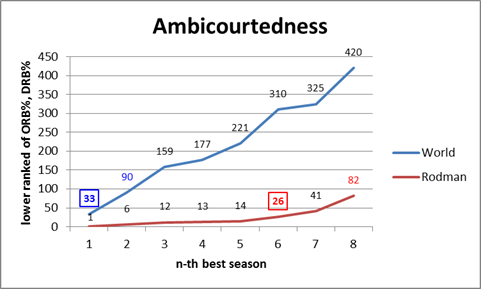
To prepare the data for this graph, I took the top 1000 rebounding seasons by total rebounding percentage (the gold-standard of rebounding statistics, as discussed in section (a)), and ranked them 1-1000 for both offensive (ORB%) and defensive (DRB%) rates. I then scored each season by the higher (larger number) ranking of the two. E.g., if a particular season scored a 25, that would mean that it ranks in the top 25 all-time for offensive rebounding percentage and in the top 25 all-time for defensive rebounding percentage (I should note that many players who didn’t make the top 1000 seasons overall would still make the top 1000 for one of the two components, so to be specific, these are the top 1000 ORB% and DRB% seasons of the top 1000 TRB% seasons).
This score doesn’t necessarily tell us who the best rebounder was, or even who was the most balanced, but it should tell us who was the strongest in the weakest half of their game (just as you might rank the off-hand of boxers or arm wrestlers). Fortunately, however, Rodman doesn’t leave much room for doubt: his 1994-1995 season is #1 all-time on both sides. He has 5 seasons that are dual top-15, while no other NBA player has even a single season that ranks dual top-30. The graph thus shows how far down you have to go to find any player with n number of seasons at or below that ranking: Rodman has 6 seasons register on the (jokingly titled) “Ambicourtedness” scale before any other player has 1, and 8 seasons before any player has 2 (for the record, Charles Barkley’s best rating is 215).
This outcome is fairly impressive alone, and it tells us that Rodman was amazingly good at both ORB and DRB – and that this is rare — but it doesn’t tell us anything about the relationship between the two. For example, if Rodman just got twice as many rebounds as any normal player, we would expect him to lead lists like this regardless of how he did it. Thus, if you believe the hypothesis that Rodman could have dramatically increased his rebounding performance just by focusing intently on rebounds, this result might not be unexpected to you.
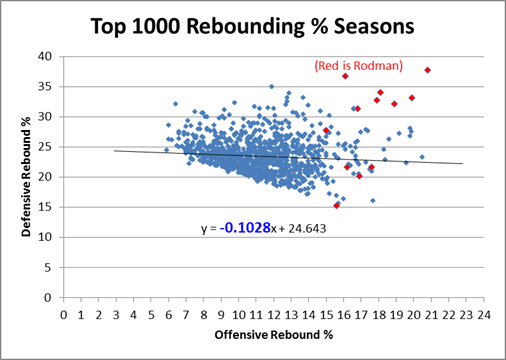
The problem, though, is that there are both competitive and physical limitations to how much someone can really excel at both simultaneously. Not the least of which is that offensive and defensive rebounds literally take place on opposite sides of the floor, and not everyone gets up and set for every possession. Thus, if someone wanted to cheat toward getting more rebounds on the offensive end, it would likely come, at least in some small part, at the expense of rebounds on the defensive end. Similarly, if someone’s playing style favors one, it probably (at least slightly), disfavors the other. Whether or not that particular factor is in play, at the very least you should expect a fairly strong regression to the mean: thus, if a player is excellent at one or the other, you should expect them to be not as good at the other, just as a result of the two not being perfectly correlated. To examine this empirically, I’ve put all 1000 top TRB% seasons on a scatterplot comparing offensive and defensive rebound rates:
Clearly there is a small negative correlation, as evidenced by the negative coefficient in the regression line. Note that technically, this shouldn’t be a linear relationship overall – if we graphed every pair in history from 0,0 to D,R, my graph’s trendline would be parallel to the tangent of that curve as it approaches Dennis Rodman. But what’s even more stunning is the following:
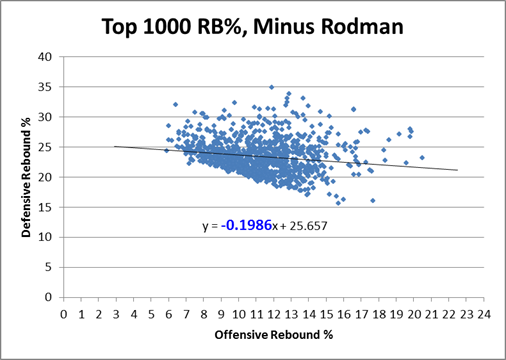
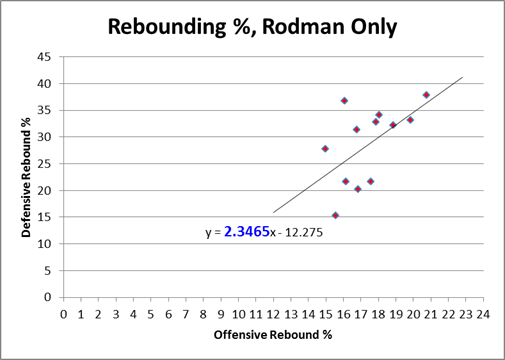
Rodman is in fact not only an outlier, he is such a ridiculously absurd alien-invader outlier that when you take him out of the equation, the equation changes drastically: The negative slope of the regression line nearly doubles in Rodman’s absence. In case you’ve forgotten, let me remind you that Rodman only accounts for 12 data points in this 1000 point sample: If that doesn’t make your jaw drop, I don’t know what will! For whatever reason, Rodman seems to be supernaturally impervious to the trade-off between offensive and defensive rebounding. Indeed, if we look at the same graph with only Rodman’s data points, we see that, for him, there is actually an extremely steep, upward sloping relationship between the two variables:
In layman’s terms, what this means is that Rodman comes in varieties of Good, Better, and Best — which is how we would expect this type of chart to look if there were no trade-off at all. Yet clearly the chart above proves that such a tradeoff exists! Dennis Rodman almost literally defies the laws of nature (or at least the laws of probability).
The ultimate point contra Barkley, et al, is that if Rodman “cheated” toward getting more rebounds all the time, we might expect that his chart would be higher than everyone else’s, but we wouldn’t have any particular reason to expect it to slope in the opposite direction. Now, this is slightly more plausible if he was “cheating” on the offensive side on the floor while maintaining a more balanced game on the defensive side, and there are any number of other logical speculations to be made about how he did it. But to some extent this transcends the normal “shift in degree” v. “shift in kind” paradigm: what we have here is a major shift in degree of a shift in kind, and we don’t have to understand it perfectly to know that it is otherworldly. At the very least, I feel confident in saying that if Charles Barkley or anyone else really believes they could replicate Rodman’s results simply by changing their playing styles, they are extremely naive.
Addendum (4/20/11):
Commenter AudacityOfHoops asks:
I don’t know if this is covered in later post (working my way through the series – excellent so far), or whether you’ll even find the comment since it’s 8 months late, but … did you create that same last chart, but for other players? Intuitively, it seems like individual players could each come in Good/Better/Best models, with positive slopes, but that when combined together the whole data set could have a negative slope.
I actually addressed this in an update post (not in the Rodman series) a while back:
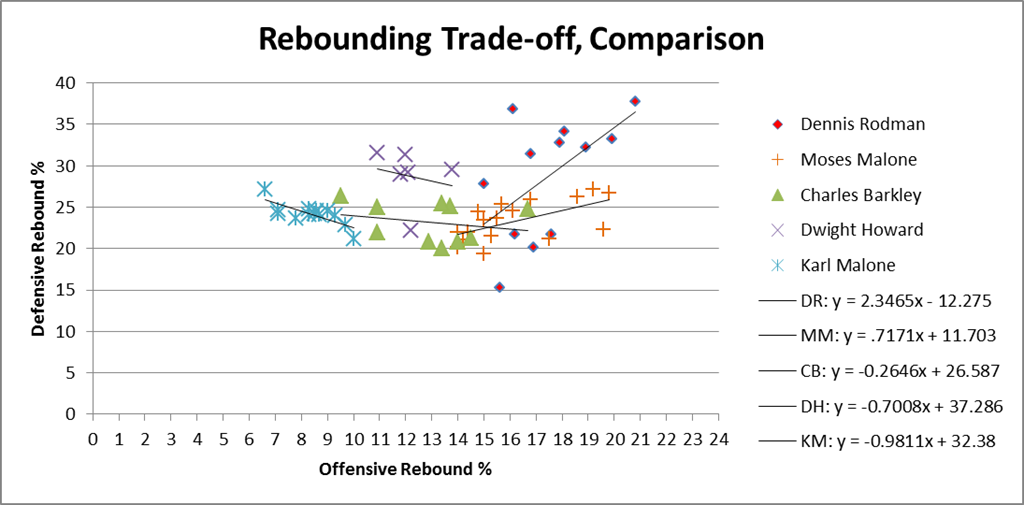
A friend privately asked me what other NBA stars’ Offensive v. Defensive rebound % graphs looked like, suggesting that, while there may be a tradeoff overall, that doesn’t necessarily mean that the particular lack of tradeoff that Rodman shows is rare. This is a very good question, so I looked at similar graphs for virtually every player who had 5 or more seasons in the “Ambicourtedness Top 1000.” There are other players who have positively sloping trend-lines, though none that come close to Rodman’s. I put together a quick graph to compare Rodman to a number of other big name players who were either great rebounders (e.g., Moses Malone), perceived-great rebounders (e.g., Karl Malone, Dwight Howard), or Charles Barkley:
By my accounting, Moses Malone is almost certainly the 2nd-best rebounder of all time, and he does show a healthy dose of “ambicourtedness.” Yet note that the slope of his trendline is .717, meaning the difference between him and Rodman’s 2.346 is almost exactly twice the difference between him and the -.102 league average (1.629 v .819).
I offer an explanation that explains the lack of a drop off in def reb rate despite excellent off rebounding for Rodman- note that I am/was a big Rodman fan and watched him play a lot. I believe that the reason he was able to grab offensive rebounds without hurting his defensive rebound rate was because he wouldn’t go back up for the shot as much as most rebounders. For example, you would expect being at opposite ends of the court to be a problem for rebounding rates if after every offensive rebound you immediately went back up for the putback (and thus give the other team a chance to get the ball back and create an opportunity for a defensive rebound that you’re not in position for, lowering your def reb rate). Rodman I noticed would, much of the time, just hold on to the ball or pass it back out without even trying to put it back up (whether this was +EV is debatable; maybe giving a better offensive teammate, like Jordan, another shot was better than him doing something he felt he wasn’t good at) and thus allow him to recover his position after the pass and not suffer the def reb rate decrease that most players, who would try to score themselves after an off reb, would suffer.
I just thought about it some more, and just came up with an explanation for why his off reb rate did not suffer despite his excellent def reb rate. It could have been because after he passed it to his teammates after securing the def rebound, his teammates, knowing that Rodman was a redunkulous offensive rebounder, would actually wait for him to get back in offensive rebounding position before being aggressive and looking for a shot (or at least be more relatively passive than players not on Rodman’s team would have been after receiving a pass from a defensive rebounder). He also played on some really good teams, with players with really high basketball IQ, so this explanation is quite plausible.
Both of your speculations seem plausible. I am especially interested in the effect that his “kicking it out” after an offensive rebound had. There are some statistical artifacts coming up in the next parts of the series that might be related: e.g., in games where Rodman played, his teams enjoyed a small but probably significant improvement in 3PT FG%. This may be due to a getting a higher number of good long-range looks from those types of possessions.
I have some questions about the ambicourtedness.
How do those blue lines look if Rodman is removed from the World Data? For example, that n-season = 1 (world) would be at least 13 spots better.
Which then led me to ask, what of magnitude? is #33 0.5% worse then Rodmans?…or is it 5% worse? Don’t get me wrong, its very impressive data (once I wrapped my head around it), but graphing of ranking (a whole # with a finite distance between every rank) all ways gives me pause.
The later graphs are a better indication of magnitude, but I’ll post the first one minus Rodman once I get off the road. It’s not that different.
I totally agree with your analysis of Rodman’s outstanding rebounding talent. I watched him for years and believe that his playing style was natural and his exclusive talent. That’s why we’ve had no one else like him and may never have another Rodman for years to come. Barkley’s comment does not stand up to scrutiny. Your analysis is much more convincing than Barkley’s. Good job, Ben.
I don’t know if this is covered in later post (working my way through the series – excellent so far), or whether you’ll even find the comment since it’s 8 months late, but … did you create that same last chart, but for other players? Intuitively, it seems like individual players could each come in Good/Better/Best models, with positive slopes, but that when combined together the whole data set could have a negative slope.
For example, imagine each player has a baseline level of OR% and DR% performance for a “poor” season, and those baselines have a negative slope in your chart above. But then any improvement upon baseline usually comes in both categories, so the within-individual slope is positive.
Hi there. I addressed that question in a roundup a while back, but not in the series directly. Thanks for bringing it up, I think I’ll attach it as an addendum to the original post:
P.S., I love Karl Malone’s near-perfect “shot group.” I always thought he was a robot!
This is probably the most interesting website I’ve found in the last year.
Just found this website – in 2020. Amazing work!