[For ease of reference—with apologies to those of you who sat through or otherwise already read my NFL Live Blog from this Sunday—I’m once again splitting a few of the topics I covered out into individual posts. I’ve made mostly made only cosmetic adjustments (additional comments are in brackets or at the end), so apologies if these posts aren’t quite as clean or detailed as a regular article. For flavor and context, I still recommend reading the whole thing.]
[I removed the “From the Live Blog” tag from the title of this post, because 1) I added a bit more explanation in my Addendum below, 2) The original discussion was at the very end of my very long live-blog post and a lot of people prob didn’t get to it anyway, and 3) I just think it’s an important issue and I don’t want to scare people away.]
With all the turnovers in [the Jets and Ravens] game, there’s about a 100% chance that commentators later will talk about the importance of “turnover differential.” People always rattle off a bunch of stats about how the team that wins the “turnover battle” almost always wins the game (like, duh), with the intention of reminding everyone how terrible it is to take the kinds of risks that lead to turnovers.
But this causation goes both ways: Turnovers can obviously cause teams to lose, but teams losing also cause turnovers. When you’re behind, you have to take risks to have any chance of winning. Citing the “turnover battle” stats without context is about as ridiculous as [the also way-overused] “Team X is 43-1 when having a 100 yard rusher.”
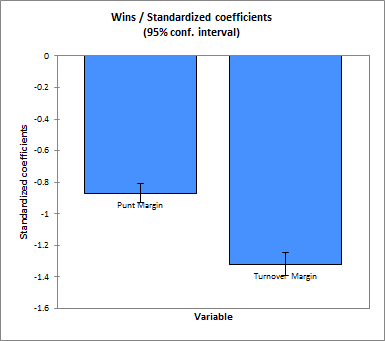
What goes unmentioned in all of this is “punt differential.” But punts also involve turning the ball over, and guess what? This stat is ALSO highly predictive of game outcomes, but without as much causation baggage: When teams are behind, they are actually forced to punt less. Despite the completely routine nature of punts vs. the “extreme” nature of turnovers, “punt differential” holds its own with “turnover differential” in a logistic regression to Win % (n=5308):
If you run this as a linear regression to point differential, it gets even closer (I should also note, if you do your regression to “outside” games, punt differential is actually more predictive, because it is much more reliable).
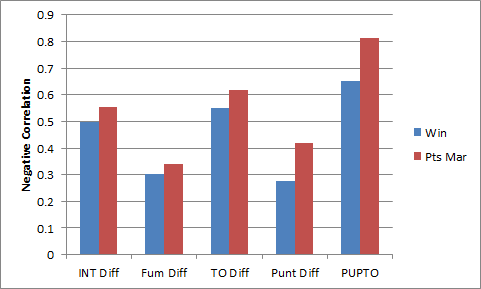
A fun metric that I love (and believe to be very useful) is “punts plus turnovers,” or PUPTO [Make it big, people!]:
A pretty interesting thing to note in this chart is the difference between the correlation to win % of interception differential vs. fumble differential. From a pure “Turnovers=Bad” perspective, this should be counter-intuitive: After all, many interceptions take place down-field, while fumbles typically happen at the line of scrimmage (also, I haven’t checked, but I feel like a disproportionate number of fumbles are returned for touchdowns). My suspicion is that this difference is at least partly [on reflection, probably mostly] explained by what I described earlier: When teams are losing, they have to take a lot of risks that lead to more interceptions, [i.e., passing a lot] but they don’t take a lot of risks [or at least as many] that lead to more fumbles.
Addendum:
To make this a bit more clear (I hope), the point is that the difference in fumbles lost should be a pretty “pure” metric for representing the consequences of turnovers. This is because they happen much more randomly than interceptions, which (both rationally and empirically) increase in frequency significantly when a team is already behind. So imagine this effect didn’t exist, and interceptions were distributed more like fumbles: we would expect the “INT Diff” bar in the chart above to drop closer to where the “Fum Diff” bar is, and consequently the “TO Diff” bar would drop as well. The “PUPTO” bar—though obviously dropping a little itself—would comparatively tower over the rest. So I don’t just love PUPTO for the way it sounds: I think it’s actually a powerful metric.
Not to mention, if I somehow had the power to instantly mainstream it, it might dampen a little bit of the stigma against “going for it” on 4th down: one of the things sports commentators and talking heads constantly seem to forget is that punts are bad too.


Also began thinking this way for basketball. Interceptions, steals, shot-clock violations, out-of-bounds, defensive rebounds are all equivalent, except for how positions and velocities of players and the ball may set up an advantageous or disadvantageous next possession.
Yet, I go on step further.
Baskets made are turnovers, too.
Most of the game of basketball is a random walk of alternating possessions. The only question is how many points you score before turning over the possession + any fouls you make the other team commit (or other things like fatigue that make scoring more points than your opponent on later possessions easier). So, you either earn 0,1,2,3,4 (and sometimes fouls) on any possession. Obviously how many 0-pt possessions a team uses, and the rate of 0-pt possessions (turnovers) is predictive of outcomes. But why treat them differently than other possession score possibilities?
At the end of a close game of football or basketball, there’s a lot of strategy, and it’s no longer nearly as random-walky.
In football, touchdowns and field goals are turnovers, too. Only safeties are magical points-scored without losing possession.
Onside kicks recovered are probably a very interesting stat to study, and are almost certainly undervalued by current NFL strategies.
{{ A fun metric that I love (and believe to be very useful) is “punts plus turnovers,” or PUPTO }}
Of course it’s useful, since teams generally get the same number of drives in a game (and the best way to get more drives relative to the opponent is to give up a touchdown to the opposing defense or special teams!), and punts plus turnovers make up the majority of non-scoring drives, with safeties, 4th downs, and missed FG all being less common.
So yeah, counting the majority of failures to score will usually predict the win unless one team’s scores are disproportionately FGs, or unless one team has an unusual number of missed kicks or 4th down failures.