One of the great false myths in basketball lore is that Wilt Chamberlain and Bill Russell were Rebounding Gods who will never be equaled, and that dominant rebounders like Dennis Rodman should count their blessings that they got to play in a era without those two deities on the court. This myth is so pervasive that it is almost universally referenced as a devastating caveat whenever sports commentators and columnists discuss Rodman’s rebounding prowess. In this section, I will attempt to put that caveat to death forever.
The less informed version of the “Chamberlain/Russell Caveat” (CRC for short) typically goes something like this: “Rodman led the league in rebounding 7 times, making him the greatest re bounder of his era, even though his numbers come nowhere near those of Chamberlain and Russell.” It is true that, barring some dramatic change in the way the game is played, Chamberlain’s record of 27.2 rebounds per game, set in the 1960-61 season, will stand forever. This is because, due to the fast pace and terrible shooting, the typical game in 1960-61 featured an average of 147 rebounding opportunities. During Rodman’s 7-year reign as NBA rebounding champion (from 1991-92 through 1997-98), the typical game featured just 84 rebounding opportunities. Without further inquiry, this difference alone means that Chamberlain’s record 27.2 rpg would roughly translate to 15.4 in Rodman’s era – over a full rebound less than Rodman’s ~16.7 rpg average over that span.
The slightly more informed (though equally wrong) version of the CRC is a plea of ignorance, like so: “Rodman has the top 7 rebounding percentages since the NBA started to keep the necessary statistics in 1970. Unfortunately, there is no game-by-game or individual opponent data prior to this, so it is impossible to tell whether Rodman was as good as Russell or Chamberlain” (this point also comes in many degrees of snarky, like, “I’ll bet Bill and Wilt would have something to say about that!!!”). We may not have the necessary data to calculate Russell and Chamberlain’s rebounding rates, either directly or indirectly. But, as I will demonstrate, there are quite simple and extremely accurate ways to estimate these figures within very tight ranges (which happen to come nowhere close to Dennis Rodman).
Before getting into rebounding percentages, however, let’s start with another way of comparing overall rebounding performance: Team Rebound Shares. Simply put, this metric is the percentage of team rebounds that were gotten by the player in question. This can be done for whole seasons, or it can be approximated over smaller periods, such as per-game or per-minute, even if you don’t have game-by-game data. For example, to roughly calculate the stat on a per-game basis, you can simply take a player’s total share of rebounds (their total rebounds/team’s total rebounds), and divide by the percentage of games they played (player gms/team gms). I’ve done this for all of Rodman, Russell and Chamberlain’s seasons, and organized the results as follows:

As we can see, Rodman does reasonably well in this metric, still holding the top 4 seasons and having a better average through 7. This itself is impressive, considering Rodman averaged about 35 minutes per game and Wilt frequently averaged close to 48.
I should note, in Chamberlain’s favor, that one of the problems I have with PER and its relatives is that they don’t give enough credit for being able to contribute extra minutes, as Wilt obviously could. However, since here I’m interested more in each player’s rebounding ability than in their overall value, I will use the same equation as above (plus dividing by 5, corresponding to the maximum minutes for each player) to break the team rebounding shares down by minute:

This is obviously where Rodman separates himself from the field, even pulling in >50% of his team’s rebounds in 3 different seasons. Of course, this only tells us what it tells us, and we’re looking for something else: Total Rebounding percentage. Thus, the question naturally arises: how predictive of TRB% are “minute-based team rebound shares”?
In order to answer this question, I created a slightly larger data-set, by compiling relevant full-season statistics from the careers of Dennis Rodman, Dwight Howard, Tim Duncan, David Robinson, and Hakeem Olajuwon (60 seasons overall). I picked these names to represent top-level rebounders in a variety of different situations (and though these are somewhat arbitrary, this analysis doesn’t require a large sample). I then calculated TRS by minute for each season and divided by 2 — roughly corresponding to the player’s share against 10 players instead of 5. Thus, all combined, my predictive variable is determined as follows:
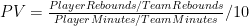
Note that this formula may have flaws as an independent metric, but if it’s predictive enough of the metric we really care about — Total Rebound % — those no longer matter. To that end, I ran a linear regression in Excel comparing this new variable to the actual values for TRB%, with the following output:

If you don’t know how to read this, don’t sweat it. The “R Square” of .98 pretty much means that our variable is almost perfectly predictive of TRB%. The two numbers under “Coefficients” tell us the formula we should use to make predictions based on our variable:

Putting the two equations together, we have a model that predicts a player’s rebound percentage based on 4 inputs:

Now again, if you’re familiar with regression output, you can probably already see that this model is extremely accurate. But to demonstrate that fact, I’ve created two graphs that compare the predicted values with actual values, first for Dennis Rodman alone:

And then for the full sample:

So, the model seems solid. The next step is obviously to calculate the predicted total rebound percentages for each of Wilt Chamberlain and Bill Russell’s seasons. After this, I selected the top 7 seasons for each of the three players and put them on one graph (Chamberlain and Russell’s estimates vs. Rodman’s actuals):

It’s not even close. It’s so not close, in fact, that our model could be way off and it still wouldn’t be close. For the next two graphs, I’ve added error bars to the estimation lines that are equal to the single worst prediction from our entire sample (which was a 1.21% error, or 6.4% of the underlying number): [I should add a technical note, that the actual expected error should be slightly higher when applied to “outside” situations, since the coefficients for this model were “extracted” from the same data that I tested the model on. Fortunately, that degree of precision is not necessary for our purposes here.] First Rodman vs. Chamberlain:

Then Rodman vs. Russell:

In other words, if the model were as inaccurate in Russell and Chamberlain’s favor as it was for the worst data point in our data set, they would still be crushed. In fact, over these top 7 seasons, Rodman beats R&C by an average of 7.2%, so if the model understated their actual TRB% every season by 5 times as much as the largest single-season understatement in our sample, Rodman would still be ahead [edit: I’ve just noticed that Pro Basketball Reference has a TRB% listed for each of Chamberlain’s last 3 seasons. FWIW, this model under-predicts one by about 1%, over-predicts one by about 1%, and gets the third almost on the money (off by .1%)].
To stick one last dagger in CRC’s heart, I should note that this model predicts that Chamberlain’s best TRB% season would have been around 20.16%, which would rank 67th on the all-time list. Russell’s best of 20.08 would rank 72nd. Arbitrarily giving them 2% for the benefit of the doubt, their best seasons would still rank 22nd and 24th respectively.