As anyone (statistically-inclined or not) can tell you, LeBron James is having a pretty good year. His 26.8 points, 8 rebounds and 7.3 assists per game (through 81) makes for another entry in his already stunning portfolio of versatile seasons: This will be his 6th time hitting 25/7/7+, a feat that has only been accomplished 8 times since the merger:
| Totals | Shooting | Per Game | |||||||||||
|---|---|---|---|---|---|---|---|---|---|---|---|---|---|
| Rk | Player | Season | Age | Tm | G | FGA | FG% | 3P% | FT% | PTS | TRB | AST | TS% |
| 1 | LeBron James | 2012-13 | 28 | MIA | 76 | 1354 | .565 | .406 | .753 | 26.8 | 8.0 | 7.3 | .640 |
| 2 | Michael Jordan* | 1988-89 | 25 | CHI | 81 | 1795 | .538 | .276 | .850 | 32.5 | 8.0 | 8.0 | .614 |
| 3 | Larry Bird* | 1986-87 | 30 | BOS | 74 | 1497 | .525 | .400 | .910 | 28.1 | 9.2 | 7.6 | .612 |
| 4 | LeBron James | 2009-10 | 25 | CLE | 76 | 1528 | .503 | .333 | .767 | 29.7 | 7.3 | 8.6 | .604 |
| 5 | LeBron James | 2010-11 | 26 | MIA | 79 | 1485 | .510 | .330 | .759 | 26.7 | 7.5 | 7.0 | .594 |
| 6 | LeBron James | 2008-09 | 24 | CLE | 81 | 1613 | .489 | .344 | .780 | 28.4 | 7.6 | 7.2 | .591 |
| 7 | LeBron James | 2007-08 | 23 | CLE | 75 | 1642 | .484 | .315 | .712 | 30.0 | 7.9 | 7.2 | .568 |
| 8 | LeBron James | 2004-05 | 20 | CLE | 80 | 1684 | .472 | .351 | .750 | 27.2 | 7.4 | 7.2 | .554 |
But the thing that sticks out (which stat-heads have been going berserk about) is his shooting, which has been by far the most efficient of his career. Indeed, it may be one of the greatest shooting efficiency seasons of all time.
While his raw shooting % wouldn’t break the top 100 seasons, and his “true” shooting % (adjusted for free throws and 3 point shots made) would still only rank about 60th, the key here is that James’ shooting efficiency is remarkable for someone with his role as both a primary option and a shooter of last resort. Generally, when you increase a player’s shot-taking responsibilities, it comes at the cost of marginal shot efficiency. This doesn’t mean this is a bad decision or that the player is doing anything wrong—what may be a bad shot “for them” may be a great shot under the circumstances in which they are asked to take it (like when the shot clock is running down, etc).
While there’s no simple stat that describes the degree to which someone is a “shot creator,” we can use usage rate as a decent (though obviously imperfect) proxy. There have been around 150 seasons in which one player “used” >=30% of their team’s possessions:
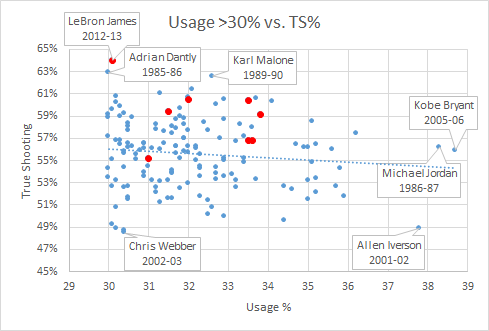
All player seasons with USG% >= 30. LeBron’s in red.
As we would expect, the best shooting percentages decline as the players’ usage rates get larger and larger. The red points are LeBron’s seasons (which are pretty excellent across the board) and as we can see from this scatter, his 2012-13 campaign is about to set the record for this group (though we should note that it’s NOT a Rodman-esqe outlier).
Amazingly, the previous record-holder was Adrian Dantley! Dantley is a Hall of Fameer who I had practically never heard of until his name kept popping up in my historical research as possibly one of the most underrated players ever.
Dantley never made an All-NBA first team or won an NBA championship, but he does extremely well in a variety of plus-minus and statistical plus-minus style metrics. While he didn’t have the all-around game of a LeBron James (though he did average a respectable 6-7 rebounds and 3-4 assists in his prime), Dantley was an extremely efficient high-usage shooter. For example, if we look at the top True Shooting seasons among players with a Usage Rate of greater than 27.5%, guess who occupies fully 5 of the top 10 spots:
| Totals | Shooting | Advanced | |||||||||
|---|---|---|---|---|---|---|---|---|---|---|---|
| Rk | Player | Season | Age | Tm | G | FG | FGA | PTS | FG% | TS% | USG% |
| 1 | Amare Stoudemire | 2007-08 | 25 | PHO | 79 | 714 | 1211 | 1989 | .590 | .656 | 28.2 |
| 2 | Adrian Dantley* | 1983-84 | 27 | UTA | 79 | 802 | 1438 | 2418 | .558 | .652 | 28.2 |
| 3 | Kevin Durant | 2012-13 | 24 | OKC | 81 | 731 | 1433 | 2280 | .510 | .647 | 29.8 |
| 4 | LeBron James | 2012-13 | 28 | MIA | 76 | 765 | 1354 | 2036 | .565 | .640 | 30.1 |
| 5 | Charles Barkley* | 1990-91 | 27 | PHI | 67 | 665 | 1167 | 1849 | .570 | .635 | 29.1 |
| 6 | Adrian Dantley* | 1979-80 | 23 | UTA | 68 | 730 | 1267 | 1903 | .576 | .635 | 27.8 |
| 7 | Adrian Dantley* | 1981-82 | 25 | UTA | 81 | 904 | 1586 | 2457 | .570 | .631 | 27.9 |
| 8 | Adrian Dantley* | 1985-86 | 29 | UTA | 76 | 818 | 1453 | 2267 | .563 | .629 | 30.0 |
| 9 | Karl Malone* | 1989-90 | 26 | UTA | 82 | 914 | 1627 | 2540 | .562 | .626 | 32.6 |
| 10 | Adrian Dantley* | 1980-81 | 24 | UTA | 80 | 909 | 1627 | 2452 | .559 | .622 | 28.4 |
Dantley was also in the news a bit last month for working part-time as a crossing guard:
I guess I’m late to this, but love anything about Adrian Dantley, who is probably underrated even as a Hall of Famer: washingtonpost.com/blogs/reliable…
— Benjamin Morris (@skepticalsports) March 21, 2013
Key quotes from that story:
“It’s not a big thing to me … I just do it. I have a routine. I exercise, I go to work, I go home. I have a spring break next week. I have a summer off, just like when I was a basketball player.”
“I just did it for the kids … I just didn’t want to sit around the house all day.”
“I’ve definitely saved two lives. I’ve almost gotten hit by a car twice. And I would say 70 percent of the people who go across my route are on their telephone or on their BlackBerry, text-messaging. I never would have seen that if I had not been on the post.”
What a character!


