A Defense of Sudden Death Playoffs in Baseball

So despite my general antipathy toward America’s pastime, I’ve been looking into baseball a lot lately.  I’m working on a three part series that will “take on” Pythagorean Expectation.  But considering the sanctity of that metric, I’m taking my time to get it right.

For now, the big news is that Major League Baseball is finally going to have realignment, which will most likely lead to an extra playoff team, and a one game Wild Card series between the non–division winners.  I’m not normally one who tries to comment on current events in sports (though, out of pure frustration, I almost fired up WordPress today just to take shots at Tim Tebow—even with nothing original to say), but this issue has sort of a counter-intuitive angle to it that motivated me to dig a bit deeper.

Conventional wisdom on the one game playoff is pretty much that it’s, well, super crazy.  E.g., here’s Jayson Stark’s take at ESPN:

But now that the alternative to finishing first is a ONE-GAME playoff? Heck, you’d rather have an appendectomy than walk that tightrope. Wouldn’t you?

Though I think he actually likes the idea, precisely because of the loco factor:

So a one-game, October Madness survivor game is what we’re going to get. You should set your DVRs for that insanity right now.

In the meantime, we all know what the potential downside is to this format. Having your entire season come down to one game isn’t fair. Period.

I wouldn’t be too sure about that.  What is fair?  As I’ve noted, MLB playoffs are basically a crapshoot anyway.  In my view, any move that MLB can make toward having the more accomplished team win more often is a positive step.  And, as crazy as it sounds, that is likely exactly what a one game playoff will do.

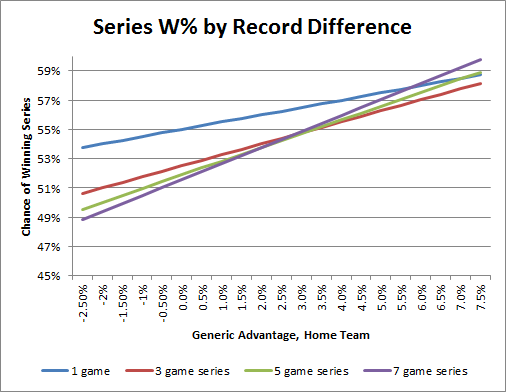
The reason is simple: home field advantage.  While smaller than in other sports, the home team in baseball still wins around 55% of the time, and more games means a smaller percentage of your series games played at home.  While longer series’ eventually lead to better teams winning more often, the margins in baseball are so small that it takes a significant edge for a team to prefer to play ANY road games:

Note: I calculated these probabilities using my favorite binom.dist function in Excel. Specifically, where the number of games needed to win a series is k, this is the sum from x=0 to x=k of the p(winning x home games) times p(winning at least k-x road games).

So assuming each team is about as good as their records (which, regardless of the accuracy of the assumption, is how they deserve to be treated), a team needs about a 5.75% generic advantage (around 9-10 games) to prefer even a seven game series to a single home game.

But what about the incredible injustice that could occur when a really good team is forced to play some scrub?  E.g., Stark continues:

It’s a lock that one of these years, a 98-win wild-card team is going to lose to an 86-win wild-card team. And that will really, really seem like a miscarriage of baseball justice. You’ll need a Richter Scale handy to listen to talk radio if that happens.

But you know what the answer to those complaints will be?

“You should have finished first. Then you wouldn’t have gotten yourself into that mess.”

Stark posits a 12 game edge between two wild card teams, and indeed, this could lead to a slightly worse spot for the better team than a longer series.  12 games corresponds to a 7.4% generic advantage, which means a 7-game series would improve the team’s chances by about 1% (oh, the humanity!).  But the alternative almost certainly wouldn’t be seven games anyway, considering the first round of the playoffs is already only five.  At that length, the “miscarriage of baseball justice” would be about 0.1% (and vs. 3 games, sudden death is still preferable).

If anything, consider the implications of the massive gap on the left side of the graph above: If anyone is getting screwed by the new setup, it’s not the team with the better record, it’s a better team with a worse record, who won’t get as good a chance to demonstrate their actual superiority (though that team’s chances are still around 50% better than they would have been under the current system).  And those are the teams that really did “[get themselves] into that mess.”

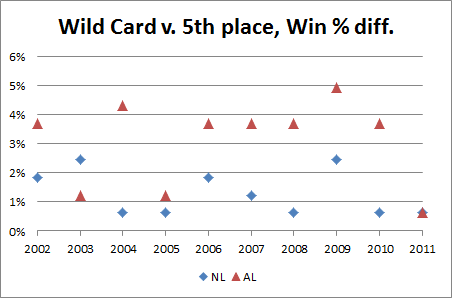
Also, the scenario Stark posits is extremely unlikely: basically, the difference between 4th and 5th place is never 12 games.  For comparison, this season the difference between the best record in the NL and the Wild Card Loser was only 13 games, and in the AL it was only seven.  Over the past ten seasons, each Wild Card team and their 5th place finisher were separated by an average of 3.5 games (about 2.2%):

Note that no cases over this span even rise above the seven game “injustice line” of 5.75%, much less to the nightmare scenario of 7.5% that Stark invokes.  The standard deviation is about 1.5%, and that’s with the present imbalance of teams (note that the AL is pretty consistently higher than the NL, as should be expected)—after realignment, this plot should tighten even further.

Indeed, considering the typically small margins between contenders in baseball, on average, this “insane” sudden death series may end up being the fairest round of the playoffs.
Yes ESPN, Professional Kickers are Big Fat Chokers

A couple of days ago, ESPN’s Peter Keating blogged about “icing the kicker” (i.e., calling timeouts before important kicks, sometimes mere instants before the ball is snapped).  He argues that the practice appears to work, at least in overtime.  Ultimately, however, he concludes that his sample is too small to be “statistically significant.”  This may be one of the few times in history where I actually think a sports analyst underestimates the probative value of a small sample: as I will show, kickers are generally worse in overtime than they are in regulation, and practically all of the difference can be attributed to iced kickers.  More importantly, even with the minuscule sample Keating uses, their performance is so bad that it actually is “significant” beyond the 95% level.

In Keating’s 10 year data-set, kickers in overtime only made 58.1% of their 35+ yard kicks following an opponent’s timeout, as opposed to 72.7% when no timeout was called.  The total sample size is only 75 kicks, 31 of which were iced.  But the key to the analysis is buried in the spreadsheet Keating links to: the average length of attempted field goals by iced kickers in OT was only 41.87 yards, vs. 43.84 yards for kickers at room temperature.  Keating mentions this fact in passing, mainly to address the potential objection that perhaps the iced kickers just had harder kicks — but the difference is actually much more significant.
To evaluate this question properly, we first need to look at made field goal percentages broken down by yard-line.  I assume many people have done this before, but in 2 minutes of googling I couldn’t find anything useful, so I used play-by-play data from 2000-2009 to create the following graph:

image

The blue dots indicate the overall field-goal percentage from each yard-line for every field goal attempt in the period (around 7500 attempts total – though I’ve excluded the one 76 yard attempt, for purely aesthetic reasons).  The red dots are the predicted values of a logistic regression (basically a statistical tool for predicting things that come in percentages) on the entire sample.  Note this is NOT a simple trend-line — it takes every data point into account, not just the averages.  If you’re curious, the corresponding equation (for predicted field goal percentage based on yard line x) is as follows:

 \large{1 - \dfrac{e^{-5.5938+0.1066x}} {1+e^{-5.5938+0.1066x}}}

The first thing you might notice about the graph is that the predictions appear to be somewhat (perhaps unrealistically) optimistic about very long kicks.  There are a number of possible explanations for this, chiefly that there are comparatively few really long kicks in the sample, and beyond a certain distance the angle of the kick relative to the offensive and defensive linemen becomes a big factor that is not adequately reflected by the rest of the data (fortunately, this is not important for where we are headed).  The next step is to look at a similar graph for overtime only — since the sample is so much smaller, this time I’ll use a bubble-chart to give a better idea of how many attempts there were at each distance:

image

For this graph, the sample is about 1/100th the size of the one above, and the regression line is generated from the OT data only.  As a matter of basic spatial reasoning — even if you’re not a math whiz — you may sense that this line is less trustworthy.  Nevertheless, let’s look at a comparison of the overall and OT-based predictions for the 35+ yard attempts only:

image

Note: These two lines are slightly different from their counterparts above.  To avoid bias created by smaller or larger values, and to match Keating’s sample, I re-ran the regressions using only 35+ yard distances that had been attempted in overtime (they turned out virtually the same anyway).

Comparing the two models, we can create a predicted “Choke Factor,” which is the percentage of the original conversion rate that you should knock off for a kicker in an overtime situation:

image

A weighted average (by the number of OT attempts at each distance) gives us a typical Choke Factor of just over 6%.  But take this graph with a grain of salt: the fact that it slopes upward so steeply is a result of the differing coefficients in the respective regression equations, and could certainly be a statistical artifact.  For my purposes however, this entire digression into overtime performance drop-offs is merely for illustration:  The main calculation relevant to Keating’s iced kick discussion is a simple binomial probability:  Given an average kick length of 41.87 yards, which carries a predicted conversion rate of 75.6%, what are the odds of converting only 18 or fewer out of 31 attempts?  OK, this may be a mildly tricky problem if you’re doing it longhand, but fortunately for us, Excel has a BINOM.DIST() function that makes it easy:

image

Note : for people who might not pick:  Yes, the predicted conversion rate for the average length is not going to be exactly the same as the average predicted value for the length of each kick.  But it is very close, and close enough.

As you can see, the OT kickers who were not iced actually did very slightly better than average, which means that all of the negative bias observed in OT kicking stems from the poor performance seen in just 31 iced kick attempts.  The probability of this result occurring by chance — assuming the expected conversion rate for OT iced kicks were equal to the expected conversion rate for kicks overall — would be only 2.4%.  Of course, “probability of occurring by chance” is the definition of statistical significance, and since 95% against (i.e., less than 5% chance of happening) is the typical threshold for people to make bold assertions, I think Keating’s statement that this “doesn’t reach the level of improbability we need to call it statistically significant” is unnecessarily humble.  Moreover, when I stated that the key to this analysis was the 2 yard difference that Keating glossed over, that wasn’t for rhetorical flourish:  if the length of the average OT iced kick had been the same as the length of the average OT regular kick,  the 58.1% would correspond to a “by chance” probability of 7.6%, obviously not making it under the magic number.

Hey, Do You Think Brett Favre is Maybe Like Hamlet?

On a lighter note:  Earlier I was thinking about how tired I am of hearing various ESPN commentators complain about Brett Favre’s “Hamlet impression” – though I was just using the term “Hamlet impression” for the rant in my head, no one was actually saying it (at least this time).  I quickly realized how completely unoriginal my internal dialogue was being, and after scolding myself for a few moments, I resolved to find the identity of the first person to ever make the Favre/Hamlet comparison.

Lo and behold, the earliest such reference in the history of the internet – that is, according to Google – was none other than Gregg Easterbrook, in this TMQ column from August 27th, 2003:

TMQ loves Brett Favre. This guy could wake up from a knee operation and fire a touchdown pass before yanking out the IV line. It’s going to be a sad day when he cuts the tape off his ankles for the final time. And it’s wonderful that Favre has played his entire (meaningful) career in the same place, honoring sports lore and appeasing the football gods, never demanding a trade to a more glamorous media market.

But even as someone who loves Favre, TMQ thinks his Hamlet act on retirement has worn thin. Favre keeps planting, and then denying, rumors that he is about to hang it up. He calls sportswriters saying he might quit, causing them to write stories about how everyone wants him to stay; then he calls more sportswriters denying that he will quit, causing them to write stories repeating how everyone wants him to stay. Maybe Favre needs to join a publicity-addiction recovery group. The retire/unretire stuff got pretty old with Frank Sinatra and Michael Jordan; it’s getting old with Favre.

Ha!

On Nate Silver on ESPN Umpire Study

I was just watching the Phillies v. Mets game on TV, and the announcers were discussing this Outside the Lines study about MLB umpires, which found that 1 in 5 “close” calls were missed over their 184 game sample.  Interesting, right?

So I opened up my browser to find the details, and before even getting to ESPN, I came across this criticism of the ESPN story by Nate Silver of FiveThirtyEight, which knocks his sometimes employer for framing the story on “close calls,” which he sees as an arbitrary term, rather than something more objective like “calls per game.”  Nate is an excellent quantitative analyst, and I love when he ventures from the murky world of politics and polling to write about sports.  But, while the ESPN study is far from perfect, I think his criticism here is somewhat off-base ill-conceived.

The main problem I have with Nate’s analysis is that the study’s definition of “close call” is not as “completely arbitrary” as Nate suggests.  Conversely, Nate’s suggested alternative metric – blown calls per game – is much more arbitrary than he seems to think.

First, in the main text of the ESPN.com article, the authors clearly state that the standard for “close” that they use is: “close enough to require replay review to determine whether an umpire had made the right call.”  Then in the 2nd sidebar, again, they explicitly define “close calls” as  “those for which instant replay was necessary to make a determination.”  That may sound somewhat arbitrary in the abstract, but let’s think for a moment about the context of this story: Given the number of high-profile blown calls this season, there are two questions on everyone’s mind: “Are these umps blind?” and “Should baseball have more instant replay?” Indeed, this article mentions “replay” 24 times.  So let me be explicit where ESPN is implicit:  This study is about instant replay.  They are trying to assess how many calls per game could use instant replay (their estimate: 1.3), and how many of those reviews would lead to calls being overturned (their estimate: 20%).

Second, what’s with a quantitative (sometimes) sports analyst suddenly being enamored with per-game rather than rate-based stats?  Sure, one blown call every 4 games sounds low, but without some kind of assessment of how many blown call opportunities there are, how would we know?  In his post, Nate mentions that NBA insiders tell him that there were “15 or 20 ‘questionable’ calls” per game in their sport.  Assuming ‘questionable’ means ‘incorrect,’ does that mean NBA referees are 60 to 80 times worse than MLB umpires?  Certainly not.  NBA refs may or may not be terrible, but they have to make double or even triple digit difficult calls every night.  If you used replay to assess every close call in an NBA game, it would never end.  Absent some massive longitudinal study comparing how often officials miss particular types of calls from year to year or era to era, there is going to be a subjective component when evaluating officiating.  Measuring by performance in “close” situations is about as good a method as any.

Which is not to say that the ESPN metric couldn’t be improved:  I would certainly like to see their guidelines for figuring out whether a call is review-worthy or not.  In a perfect world, they might even break down the sets of calls by various proposals for replay implementation.  As a journalistic matter, maybe they should have spent more time discussing their finding that only 1.3 calls per game are “close,” as that seems like an important story in its own right.  On balance, however, when it comes to the two main issues that this study pertains to (the potential impact of further instant replay, and the relative quality of baseball officiating), I think ESPN’s analysis is far more probative than Nate’s.

Player Efficiency Ratings—A Bold ESPN Article Gets it Exactly Wrong

Tom Haberstroh, credited as a “Special to ESPN Insider” in his byline, writes this 16 paragraph article, about how “Carmelo Anthony is not an elite player.” Haberstroh boldly — if not effectively — argues that Carmelo’s high shot volume and correspondingly pedestrian Player Efficiency Rating suggests that not only is ‘Melo not quite the superstar his high scoring average makes him out to be, but that he is not even worth the max contract he will almost certainly get next summer.  Haberstroh further argues that this case is, in fact, a perfect example of why people should stop paying as much attention to Points Per Game and start focusing instead on PER’s.

I have a few instant reactions to this article that I thought I would share:

  1. Anthony may or may not be overrated, and many of Haberstroh’s criticisms on this front are valid — e.g., ‘Melo does have a relatively low shooting percentage — but his evidence is ultimately inconclusive.
  2. Haberstroh’s claim that Anthony is not worth a max contract is not supported at all.  How many players are “worth” max contracts?  The very best players, even with their max contracts, are incredible value for their teams (as evidenced by the fact that they typically win).  Corollary to this, there are almost certainly a number of players who are *not* the very best, who nevertheless receive max contracts, and who still give their teams good value at their price.  (This is not to mention the fact that players like Anthony, even if they are overrated, still sell jerseys, increase TV ratings, and put butts in seats.)
  3. One piece of statistical evidence that cuts against Haberstroh’s argument is that Carmelo has a very solid win/loss +/- with the Nuggets over his career.  With Melo in the lineup, Denver has won 59.9% of their games (308-206), and without him in the lineup over that period, they have won 50% (30-30).  While 10% may not sound like much, it is actually elite and compares favorably to the win/loss +/- of many excellent players, such as Chris Bosh (9.1%, and one of the top PER players in the league) and Kobe Bryant (4.1%).  All of these numbers should be treated with appropriate skepticism due to the small sample sizes, but they do trend accurately.

But the main point I would like to make is that — exactly opposite Haberstrom — I believe Carmelo Anthony is, in fact, a good example of why people should be *more* skeptical of PER’s as the ultimate arbiter of player value. One of the main problems with PER is that it attempts to account for whether a shot’s outcome is good or bad relative to the average shot, but it doesn’t account for whether the outcome is good or bad relative to the average shot taken in context.  The types of shots a player is asked to take vary both dramatically and systematically, and can thus massively bias his PER.  Many “bad” shots, for example, are taken out of necessity: when the clock is winding down and everyone is defended, someone has to chuck it up.  In that situation, “bad” shooting numbers may actually be good, if they are better than what a typical player would have done.  If the various types of shots were distributed equally, this would all average out in the end, and would only be relevant as a matter of precision.  But in reality, certain players are asked to take the bad shot more often that others, and those players are easy enough to find: they tend to be the best players on their teams.

This doesn’t mean I think PER is useless, or irreparably broken.  Among other things, I think it could be greatly improved by incorporating shot-clock data as a proxy to model the expected value of each shot (which I hope to write more about in the future).  However, in its current form it is far from being the robust and definitive metric that many basketball analysts seem to believe.  Points Per Game may be an even more useless metric — theoretically — but at least it’s honest.